Linking OMERO with elabFTW
by Rodrigo Escobar Díaz Guerrero and Jamile Jafari
This document is designed to guide users in effectively managing and organizing their scientific data using OMERO (Open Microscopy Environment) and elabFTW, a leading electronic lab notebook (ELN) software.
In the field of life science research, lab experiments are traditionally recorded in physical lab notebooks, but many researchers are now turning to Electronic Lab Notebooks (ELNs) as a more efficient and accessible way to manage their records [1]. ELNs make it easier to access information and extract data for analysis, which is particularly useful when dealing with diverse samples like cells, tissues, and fluids, where digital images are often generated and analyzed in various formats. OMERO provides a platform for managing bioimages, allowing researchers to organize, analyze, and share their data using web technologies.
elabFTW is an open-source electronic lab notebook designed to support scientific research across various disciplines. It enables researchers to record, organize, and manage their experimental data in a structured and secure way.
OMERO is a powerful tool that allows you to store, visualize, and analyze large datasets, particularly imaging data. It provides a centralized platform for data management, ensuring that your research data is secure, well-organized, and accessible.
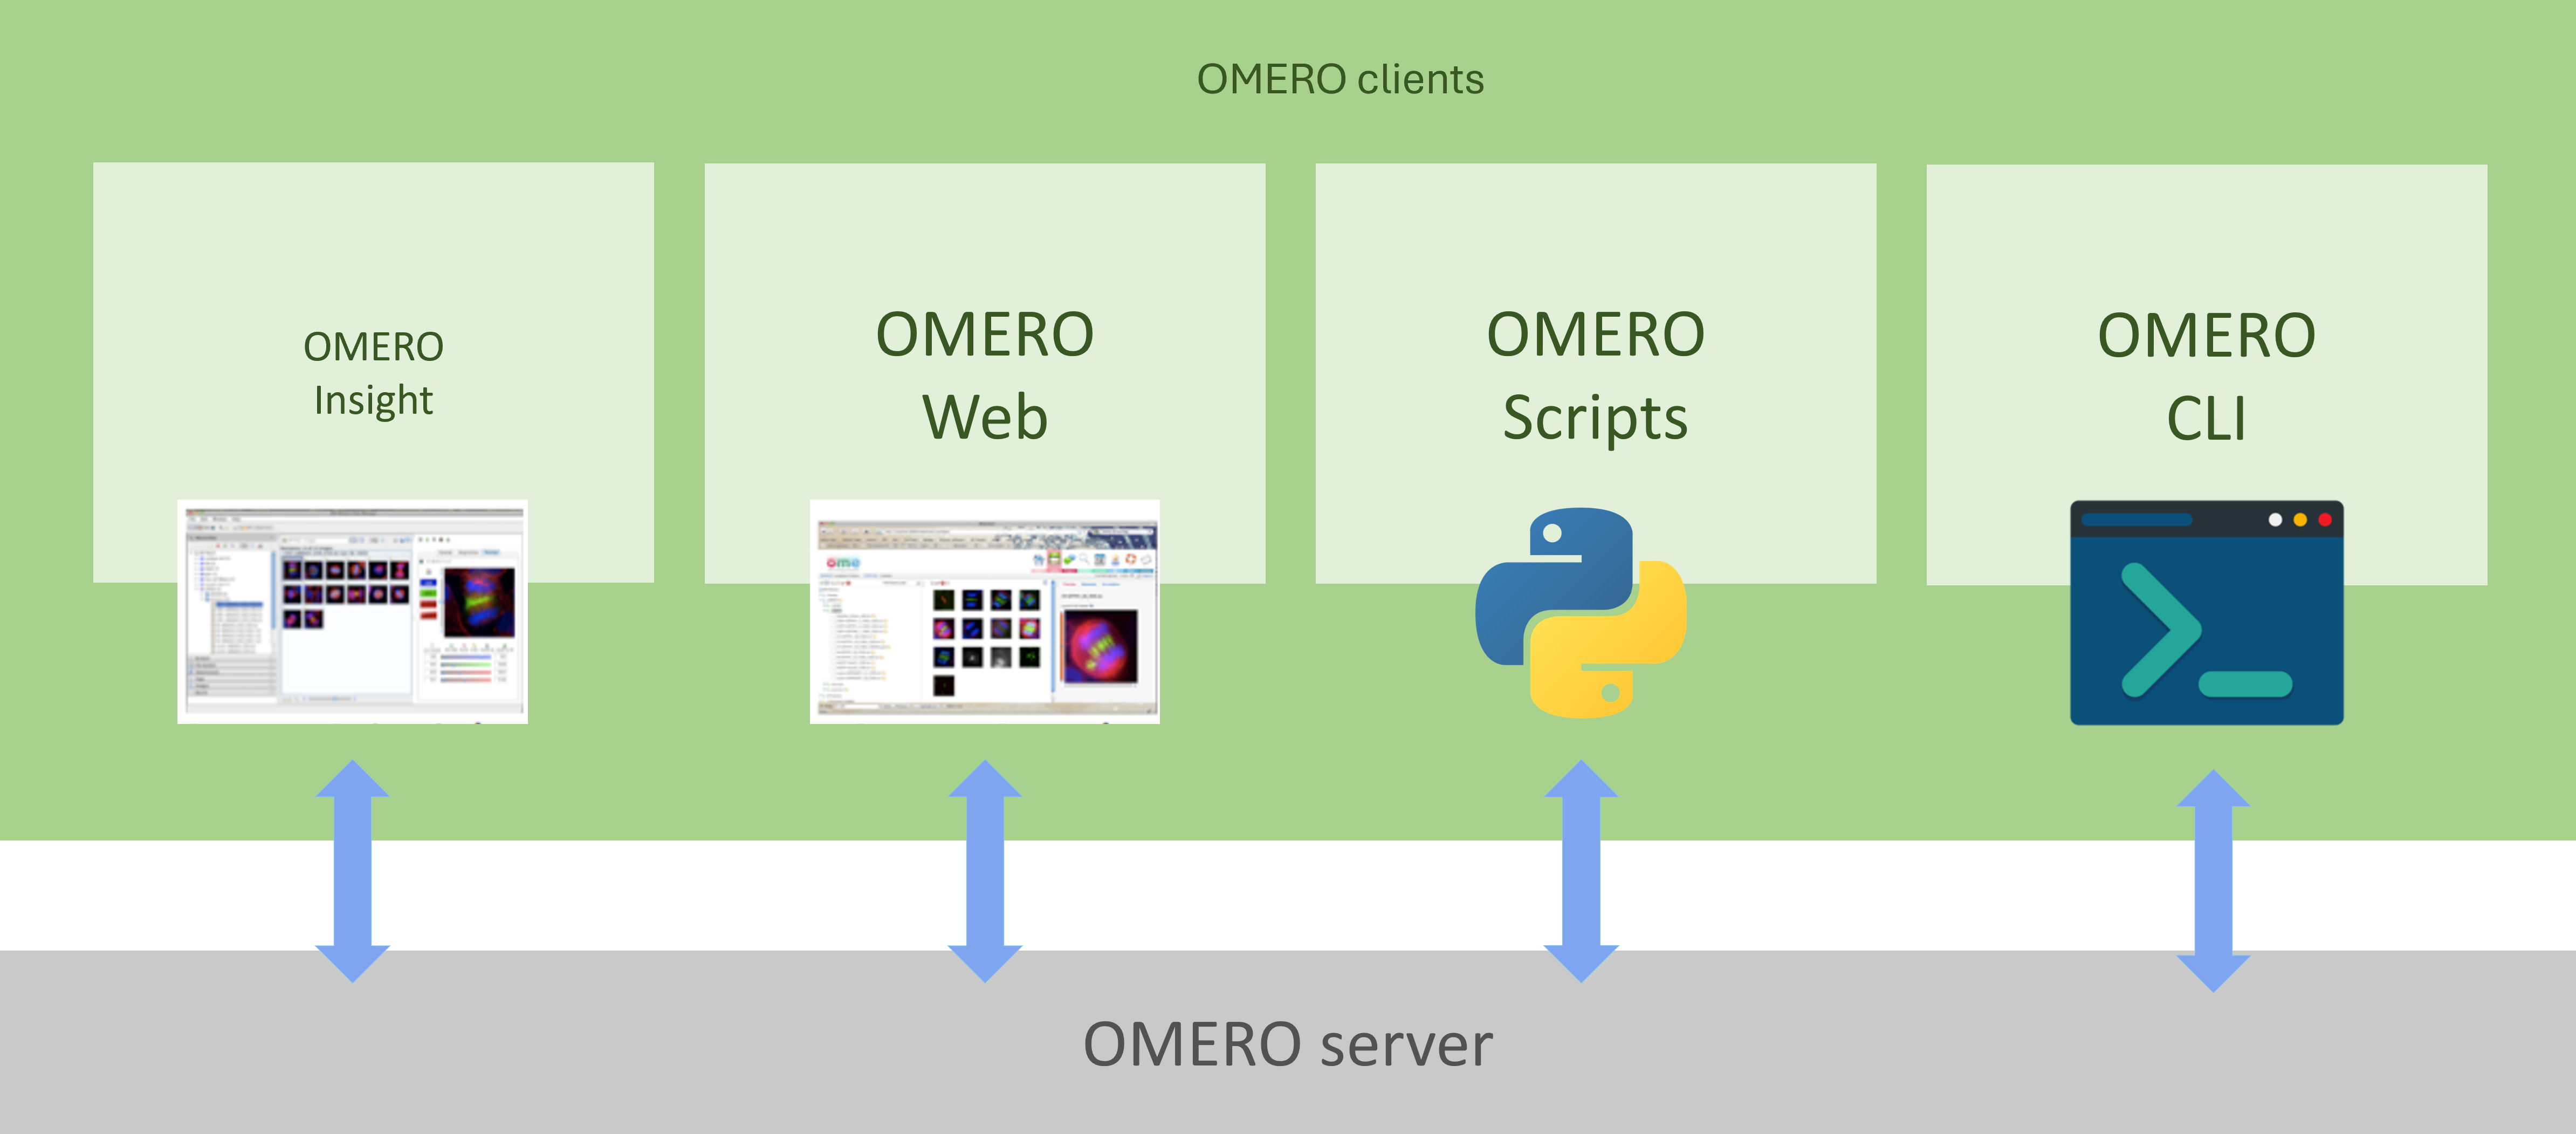
OMERO is an open-source client-server system that provides flexible interaction with the server through various clients (Figure 1). Users can access data via desktop software (OMERO Insight), a web browser (OMERO Web), scripts, or the command-line interface. Additionally, it is possible to develop custom clients using different programming languages.
OMERO offers multiple ways to upload images to the server. To keep it simple for all users, this manual will focus on the desktop client, OMERO.insight. However, advanced users can refer to the official documentation for alternative methods, such as using the command-line interface (CLI) or OMERO.dropbox. This manual was adapted from the official documentation available in link .
To upload images to OMERO, the first step is to download and install the OMERO.insight desktop application. Follow these instructions for installation:.
Download the OMERO.insight client corresponding to your operating system at: https://www.openmicroscopy.org/omero/downloads
Windows
From version 5.5.0, OMERO.insight comes with two installers: .msi and .exe.
Click onto the downloaded .exe or .msi
file.
This will run the installer. The .exe
file installs by default in the userspace apps folder. This can be changed during the installation
process.
The .msi installer
will deploy the application in the Program
Files folder of Windows. OMERO.insight is then
available to all the users of the target machine. OMERO.insight installed in the userspace
is only available to the user who did the installation. A Desktop icon and a new
OMERO.insight Start menu item will be created.
Mac
From version 5.5.0, OMERO.insight can be installed using an Apple DMG (.dmg) file.
Mac OS X: Click onto the downloaded .dmg
installer to start the installation.
This will mount the DMG it to your Mac. The DMG mounts in two places: on your Desktop and in the Finder sidebar under your hard drive.
Clicking either one of these opens the DMG file. When you open a DMG file, you will usually see two things:
the app itself.
a link to your applications folder.
Depending on your settings, the Applications folder icon might not appear. In such case, drop the app icon into the Applications folder.
Linux
Unzip the downloaded .zip file.
Click on the omero-insight file to start the application.
Open OMERO.insight and in the login dialog, click on the wrench icon
 .
.
This will open a list of servers to which you can connect. By default, only “localhost” is listed. Click on the plus icon to add a new line to the list and type into "repo.ipht-jena.de" .
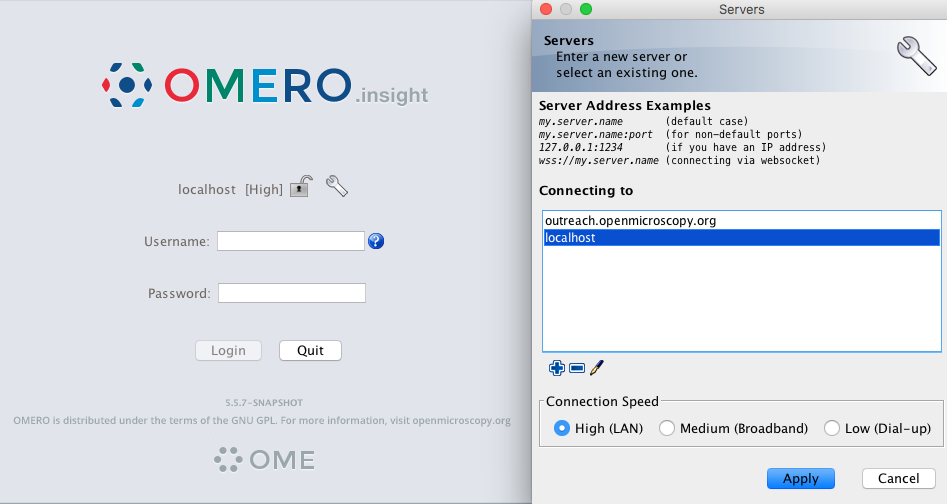
When done, click Apply.
Log in using the username and password provided.
In OMERO.insight, click on the Importer Icon  in the toolbar.
Browse your local hierarchy in the left-hand pane of the importer, select single images or whole
folders and add these to the Queue by clicking on the arrow  icon.
icon.
In the Import Location window, select the target Project and Dataset (existing or create a new one) to import to.
Note: If no Dataset is selected or created, a new Dataset will be automatically created and named after the folder containing the images to be imported.
Optional: Go to the Options tab
Click on 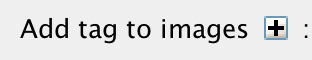 to bring the Tag selection
dialog.
to bring the Tag selection
dialog.
Select the tag(s) on the left-hand side or create a new one.
Click to move the tag(s) to the
right-hand side.
Click Save.
Click on the Import button in the bottom-right corner of the Importer window. You should see two progress bars for every image imported, Upload and Processing.
Note: The import of the next image in the queue starts immediately after the Upload of the previous one is finished. The Processing phase of the import is done on the OMERO.server only, and can be finished while the next image(s) is/are being uploaded to the server.
Once imports are finished, go back to the OMERO.insight main window and click the Refresh button
 above the right-hand pane. This will display the
imported images inside the Dataset and/or Project you specified previously in the Import Location
window.
above the right-hand pane. This will display the
imported images inside the Dataset and/or Project you specified previously in the Import Location
window.
Tags are essential tools for organizing and annotating bioimaging data in OMERO. Tags can be applied at various levels (image, dataset, or project) and help researchers categorize and easily search for specific data. Key-value pairs, on the other hand, allow for metadata enrichment.
In traditional file systems, organizing data through file hierarchies can become cumbersome, especially when searching for specific combinations of metadata (e.g., treatment, staining targets, time points). OMERO provides flexibility by allowing dynamic rearrangement of data using tags. This enables researchers to search for images across multiple datasets and projects without reorganizing the underlying file structure.
Tags can be manually added in OMERO.web or OMERO.insight, during data upload using the OMERO importer, or automatically via the auto-tag function in OMERO.web (if installed by the admin).
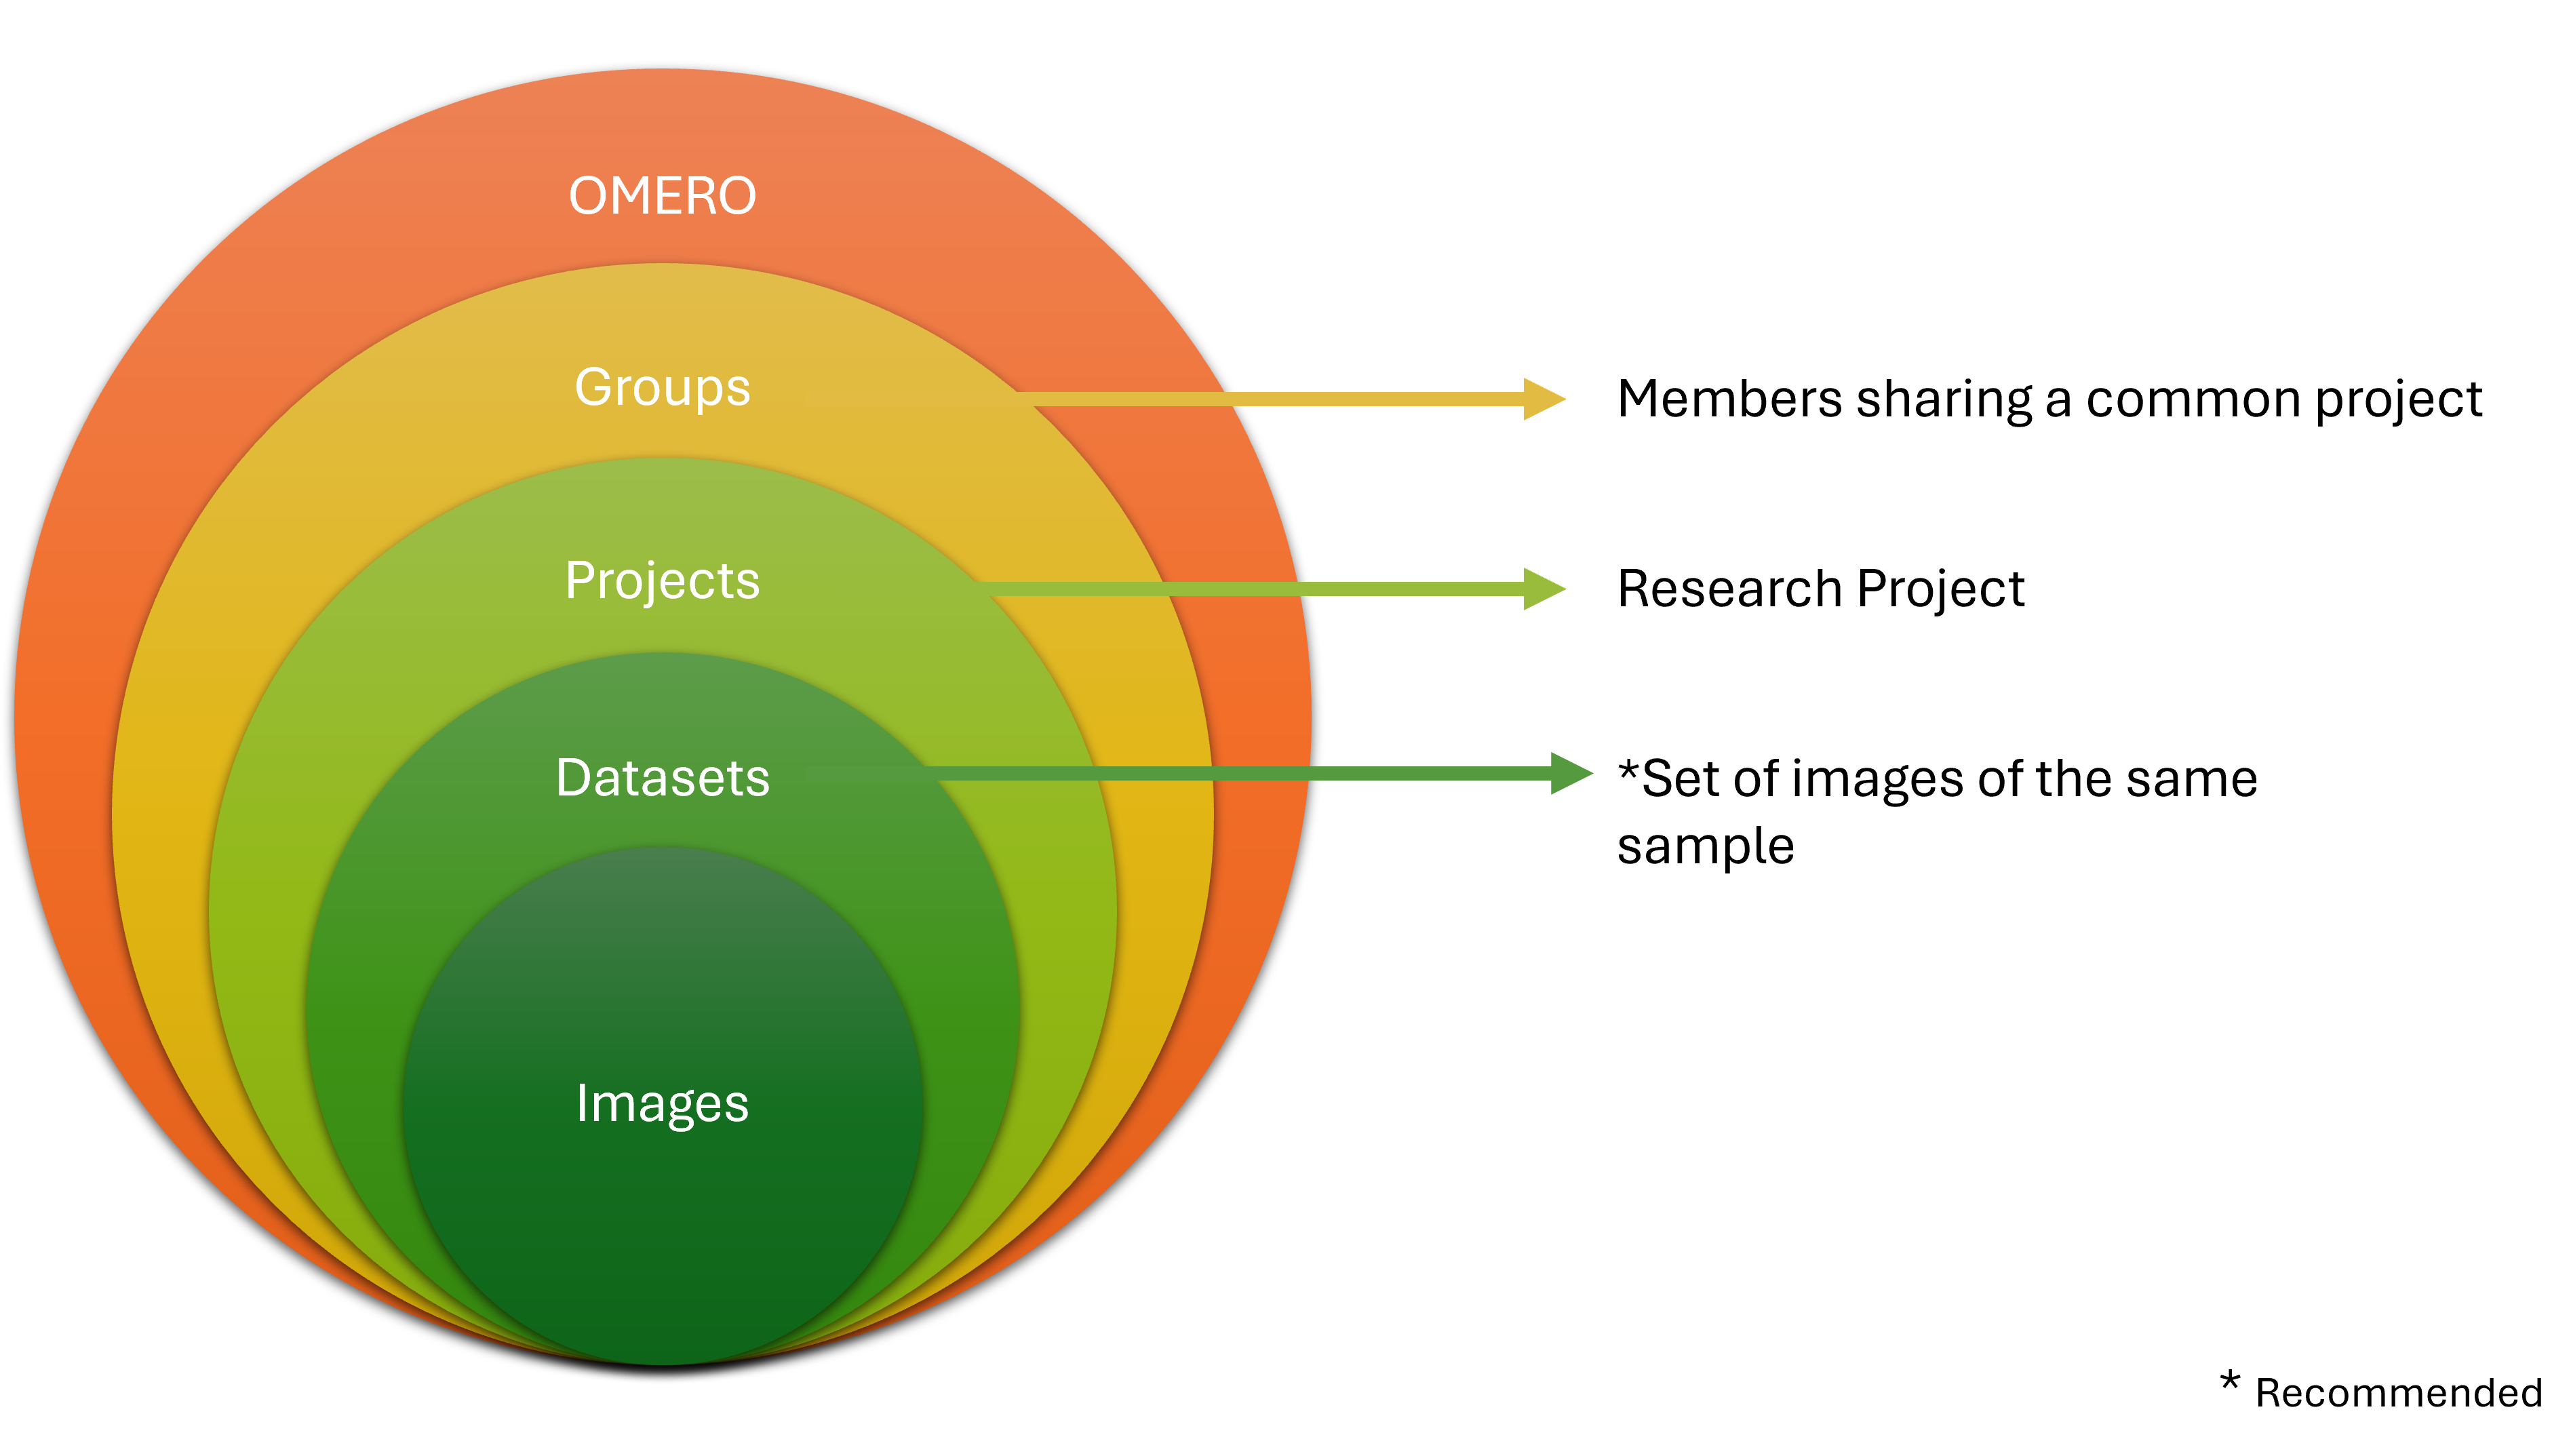
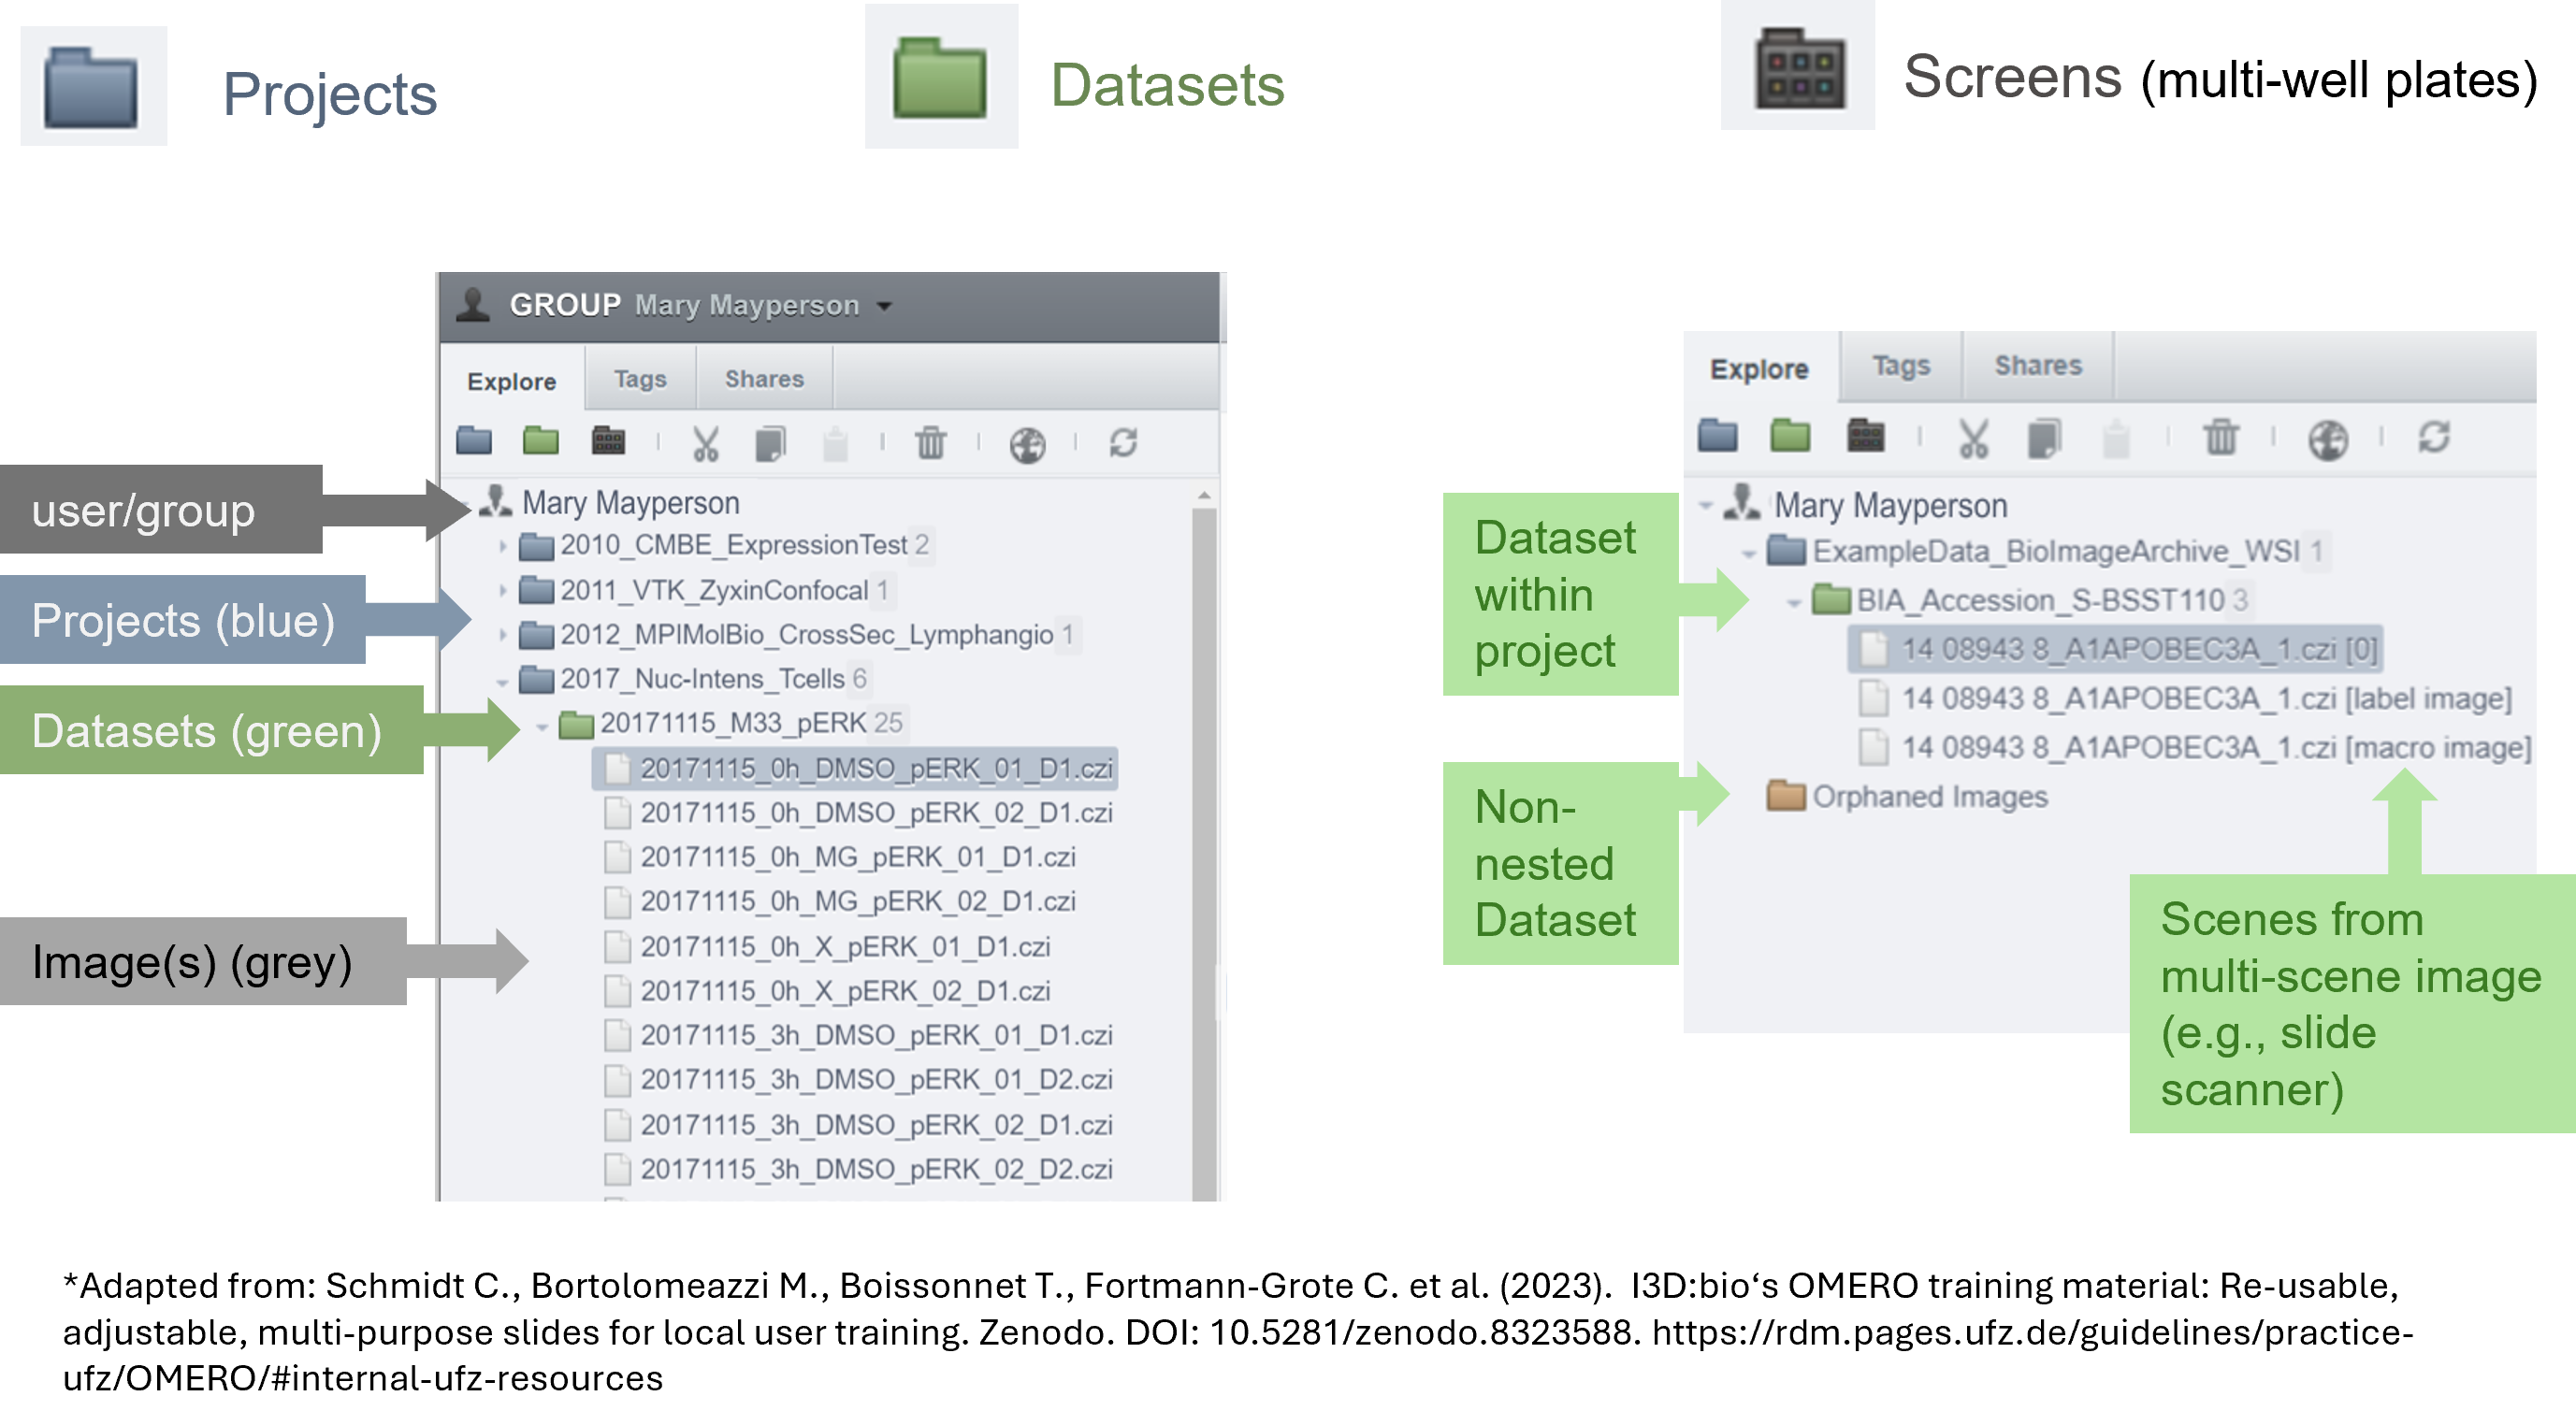
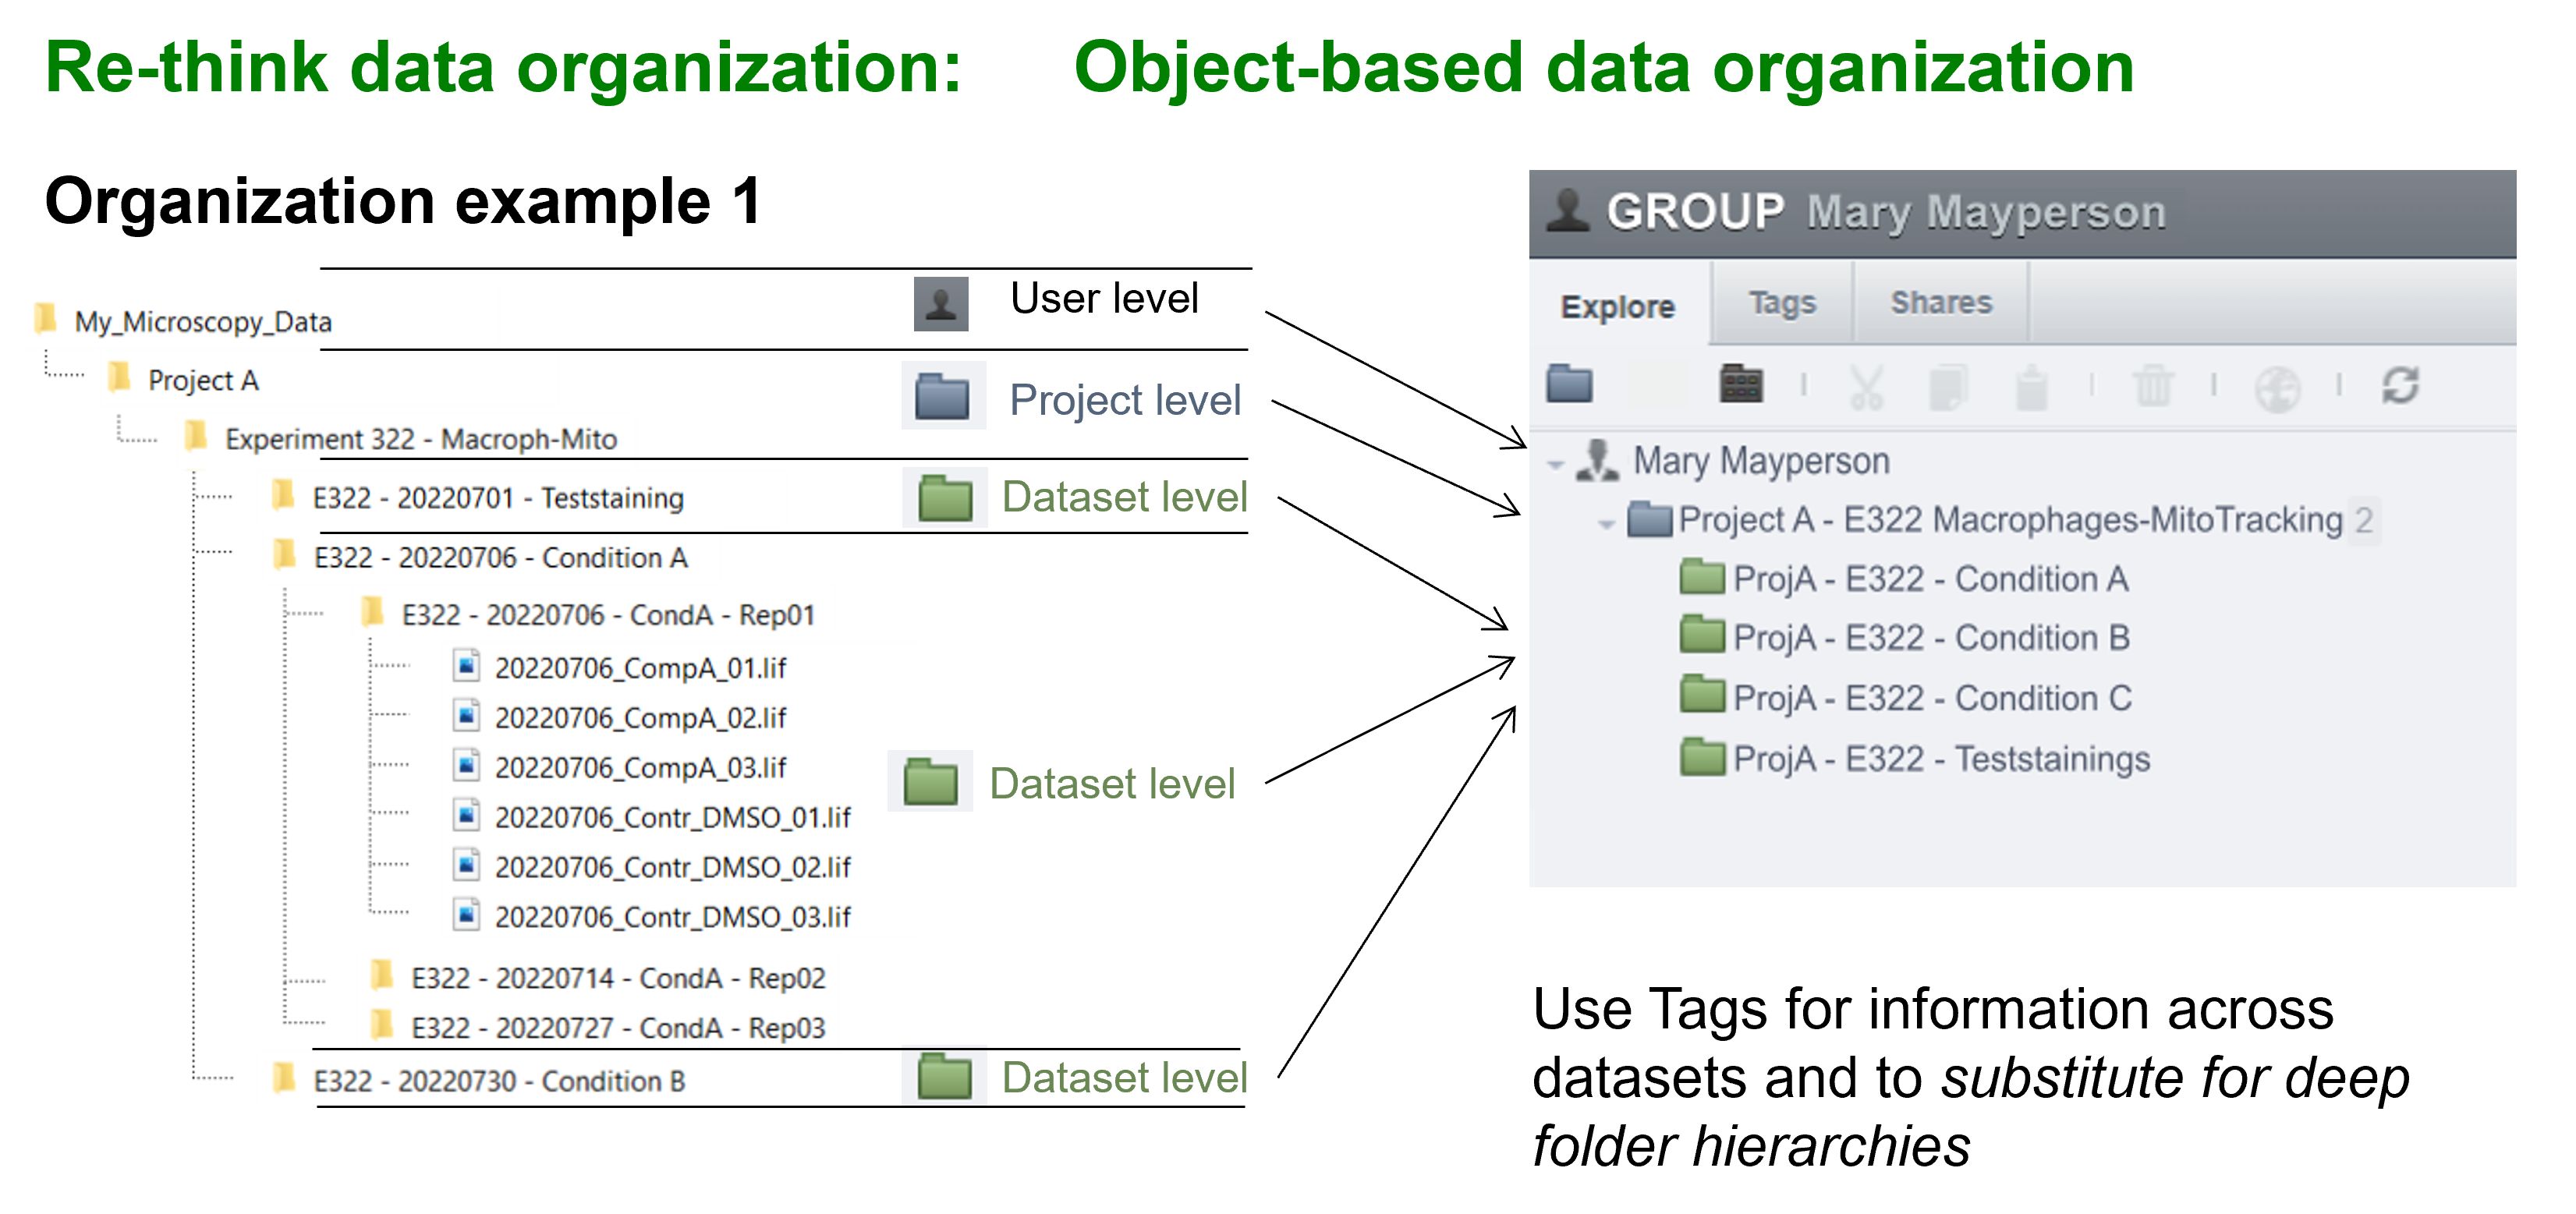
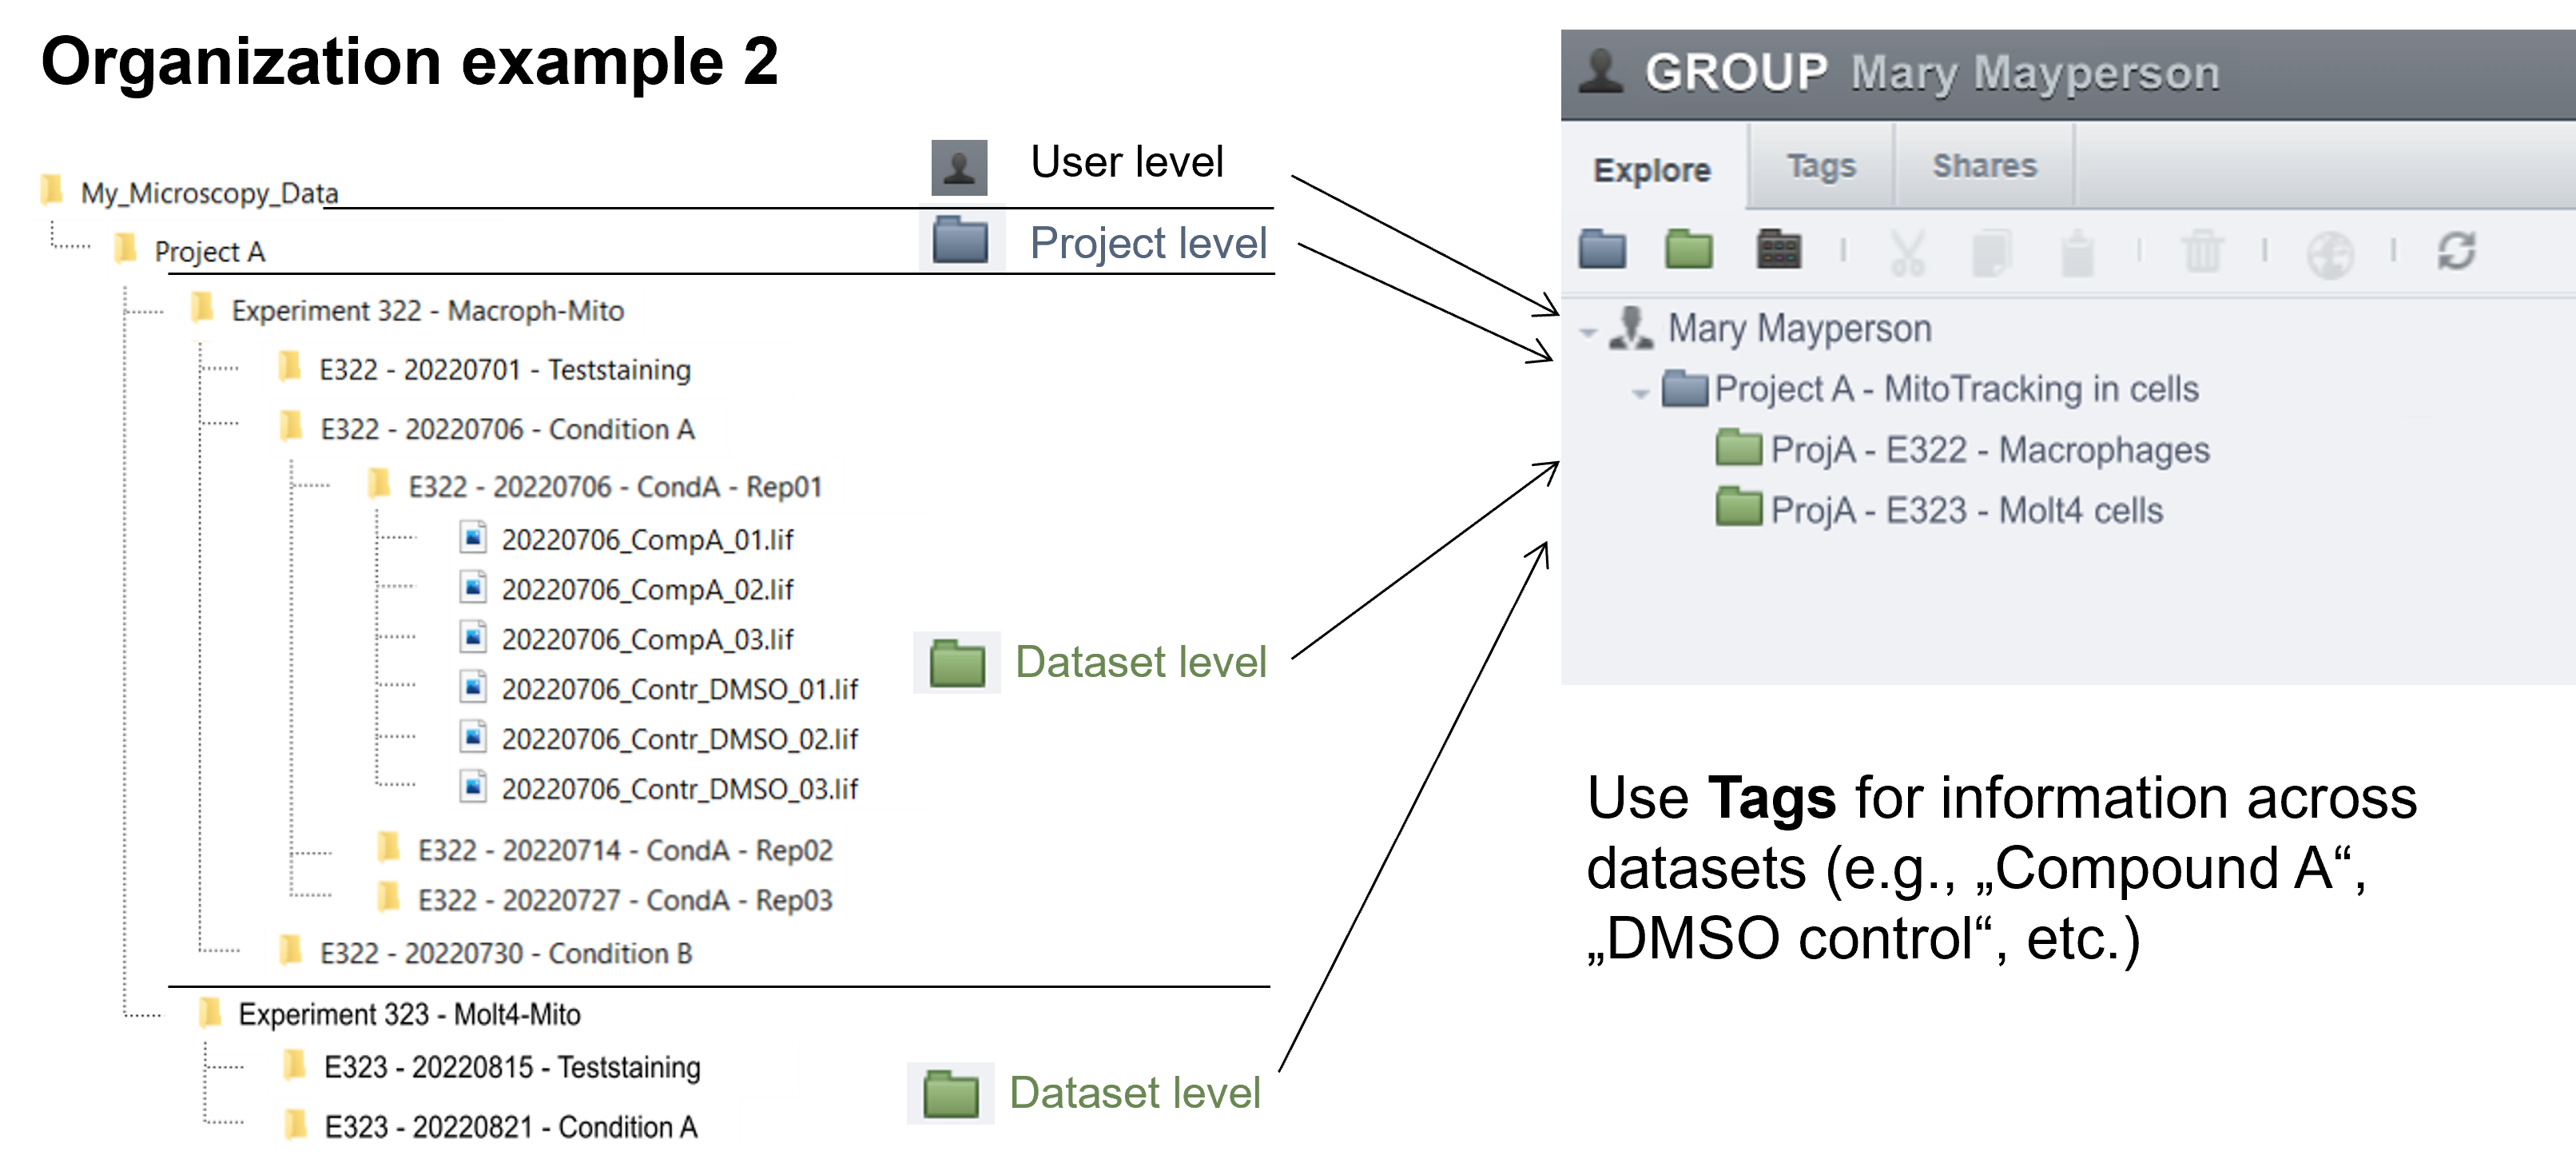
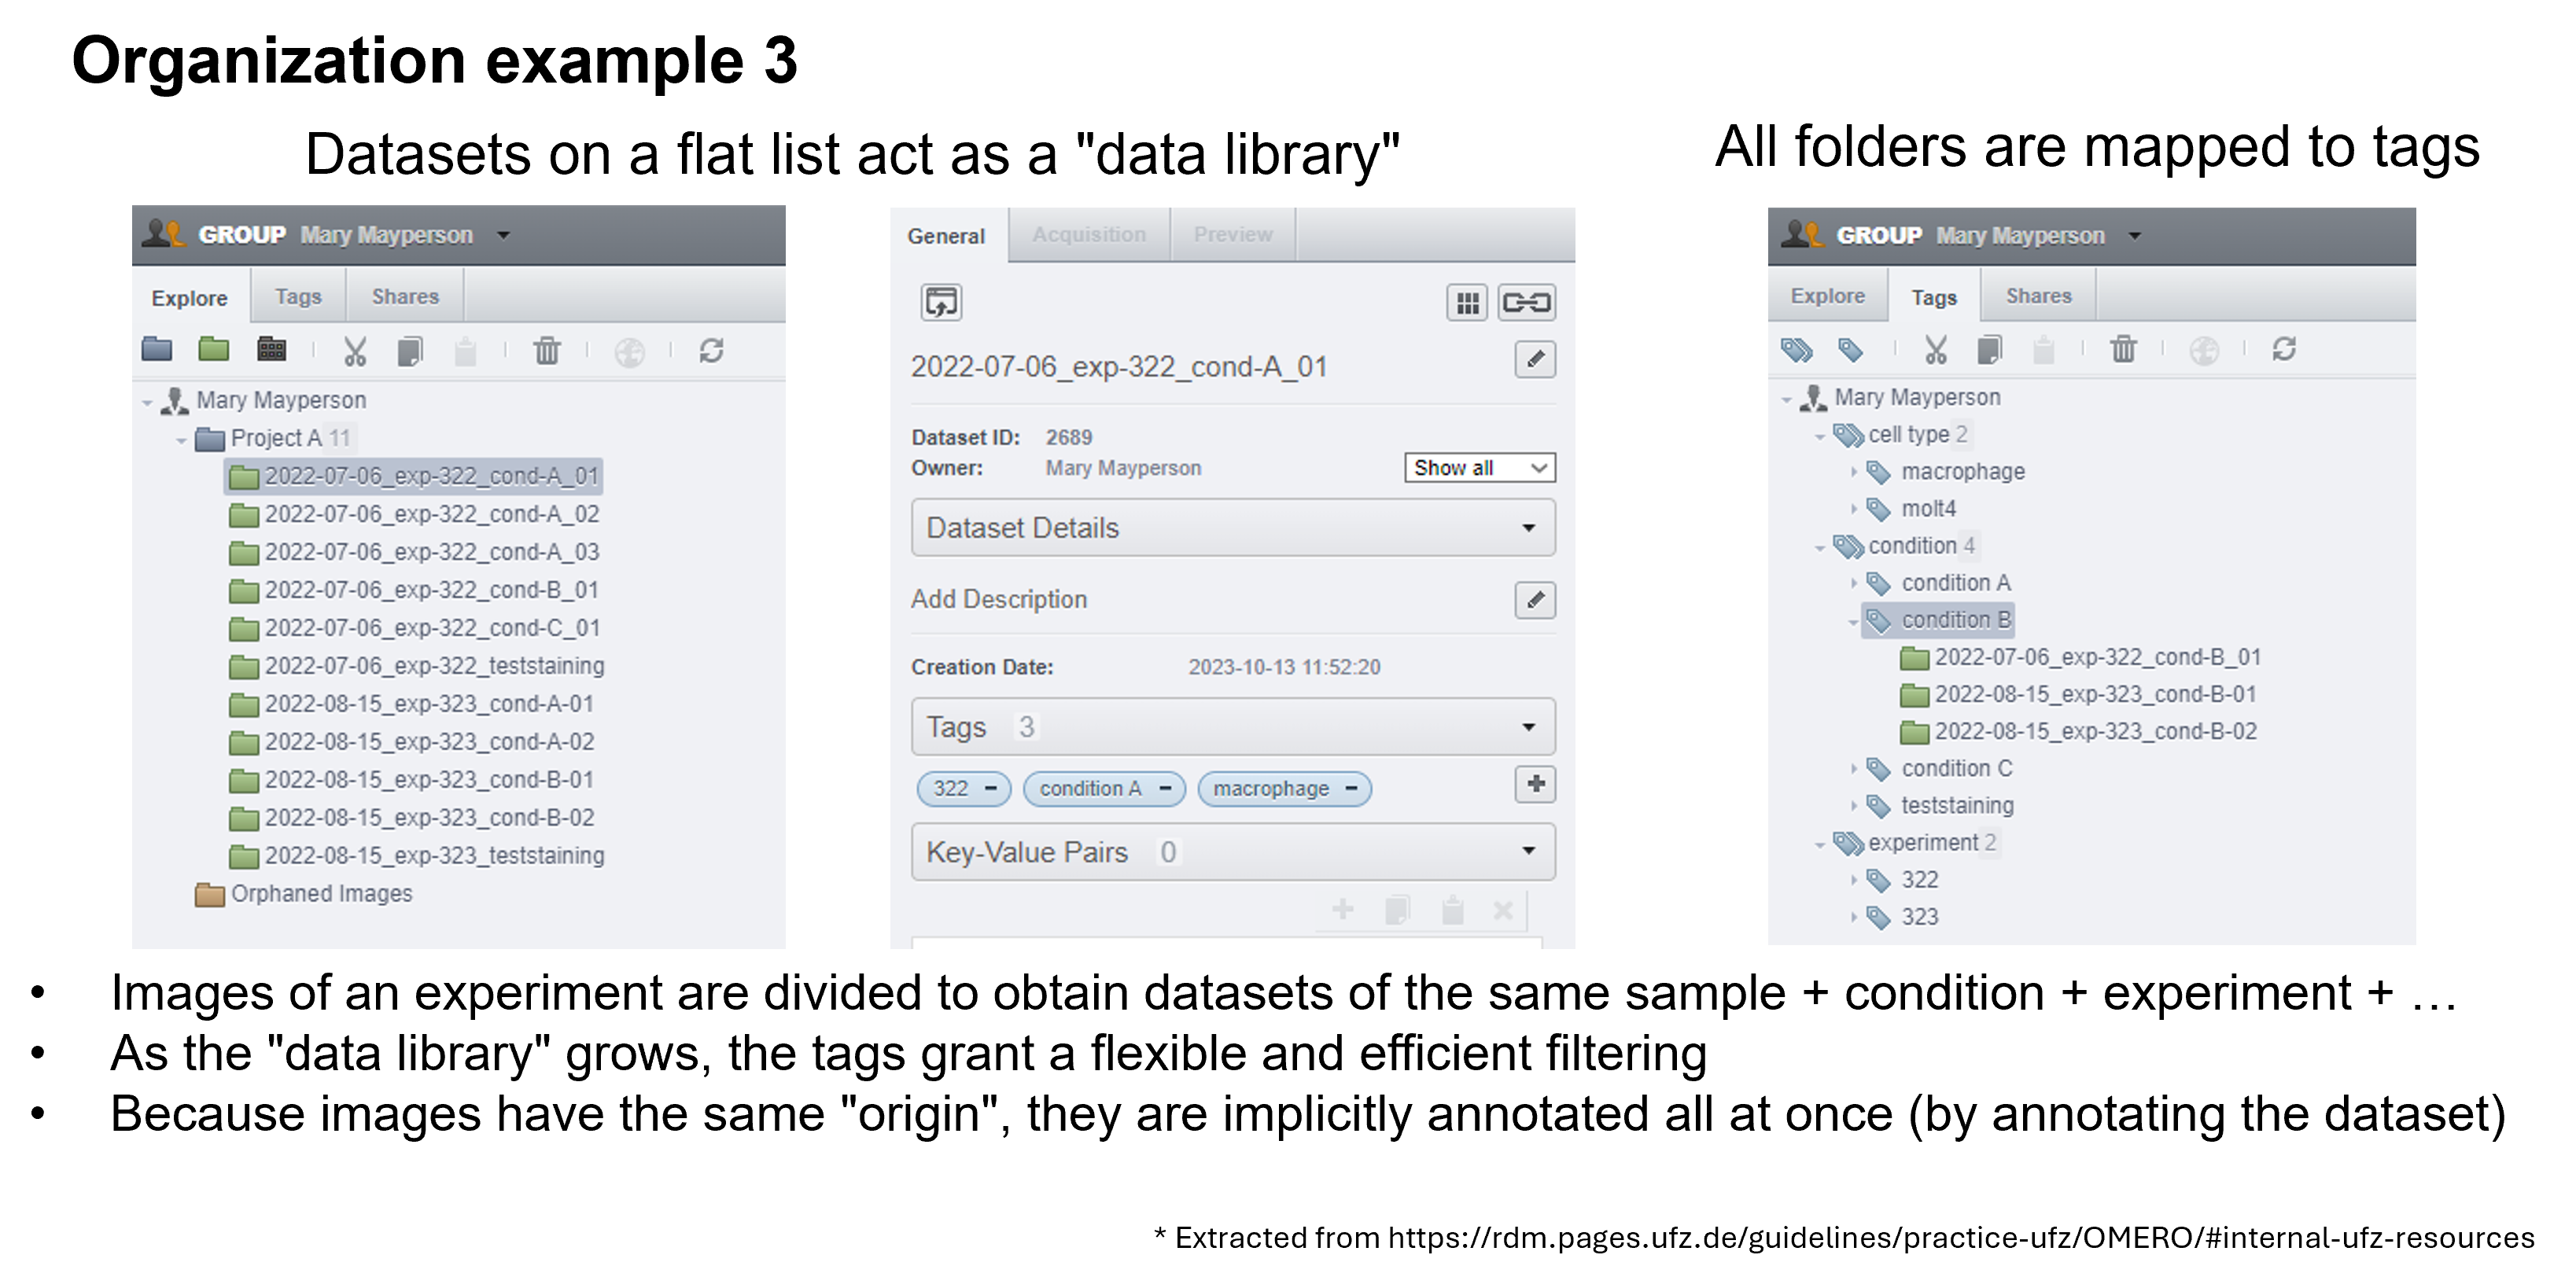
OMERO provides only two levels of hierarchy: Projects and Datasets (Figure 4). However, in our experiments, we often work with more complex folder hierarchies. How can we adapt a folder hierarchy to OMERO's two-level system? We propose using a tagging system suggested by Schmidt C. et al., which outlines three possible scenarios for translating a folder structure into OMERO's organizational framework (Figure 5). In the first scenario, the first level of subfolders under a project is translated into datasets, while each subsequent subfolder is added as a tag. In the second scenario, a dataset is created for each experiment, and tags are applied to capture any additional information. In the final scenario, datasets are created for the lowest level of subfolders, and tags are added to reference the parent folders. We recommend using the third scenario, as it offers greater flexibility and is easier for users to understand.
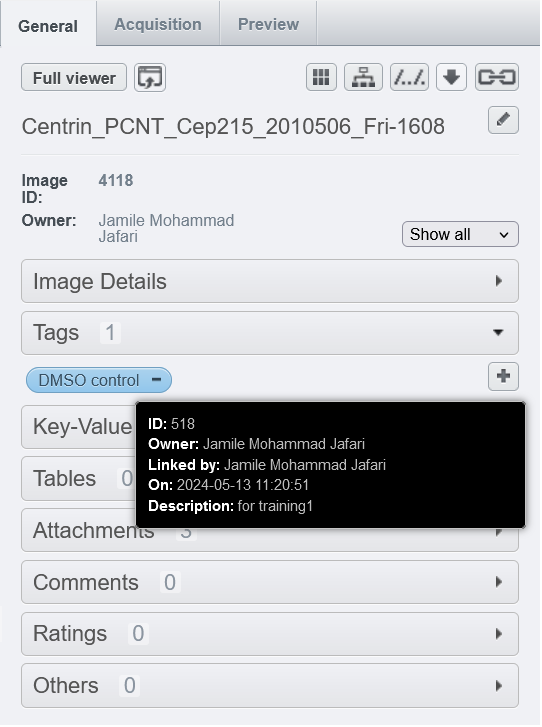
Key-value pairs are introduced in OMERO as a flexible method for annotating metadata. A key represents an object or concept, and the value provides specific details for that key. These annotations are part of the metadata and can be applied to images, datasets, and projects under the "General" tab.
There are three ways to annotate metadata in OMERO:
In elabFTW, there are two main types of entities (objects): Experiments and Resources. Experiments are owned by individual users, while Resources belong to a team.
Although similar, they differ in a few key ways:
Despite these differences, both share many attributes, such as tags, category, status, and links. This manual focuses on the use of experiments in elabFTW, and the details were extracted from the official user manual available at the following link: https://doc.elabftw.net/user-guide.html.
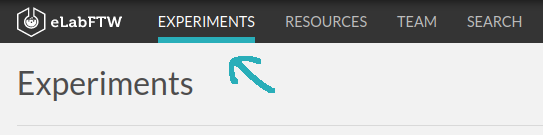
To create experiments in elabFTW, you must first log in at "https://elab.ipht-jena.de".Then select Experiments from the main menu. It will display a list of Experiments, this is “Show mode”.
Experiments are listed by default mixed with experiments from other users in your team.
You can create an experiment by clicking the «Create» button on the top right of the screen. You will then be presented with an «edition» page; the two other modes being ‘view’: display a single experiment, and ‘show’: display a list of experiments.
An experiment is composed of:
A title
The main text content
These are the two required elements. In fact, only the title is required as the main content can be empty.
In edit mode, the top part of the page displays a toolbar with several actions available, the main ones are:
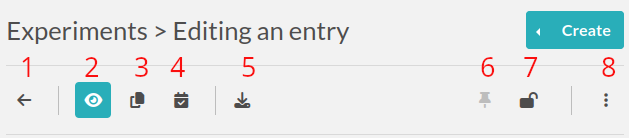
Go back to the listing
Go into “View” mode
Duplicate the experiment: will copy all content except attachments, change the Status to the default one, and set the Date to today’s date
Timestamp experiment: create a signed, legally binding snapshot of the experiment and store it alongside the attached files in an immutable archive
Export menu: export the experiment in various formats (PDF, ELN, CSV, etc…)
Pin the experiment: make it appear on top of the listing at all times
Lock/Unlock experiment: prevent further edition. If you’re the one locking it, you’ll be able to unlock it, but if it’s locked by someone else, you won’t
Ellipsis menu:
- See revisions: the revisions system keeps track of changes in the main text of the experiment
- See changelog: the changelog system keeps track of all the other changes of the experiment
- Archive/Unarchive: allow hiding the entry from the default listing
- Delete: perform a soft-deletion of the experiment: mark the experiment as deleted but keep it in the backend database
The date is today’s date by default. You can edit it as you wish. The effective creation timestamp is stored in the backend database in another (read-only) attribute.
This attribute is not editable and corresponds to the unique (scoped to the instance), immutable ID of the entry.
The title of your experiment. A duplicated experiment will have a «I» character appended to the title upon creation.
This useful feature lets you set the ‘status’ of an experiment. By default you can have:
Running (selected upon creation)
Need to be redone
Success
Fail
These status can be modified completely by the admin in the admin panel.
The tags allow you to easily group experiments together. You can think of it as folders, but more powerful because each experiment can have many tags, thus allowing you to cross-search efficiently! All experiments with the same tag will be accessible by clicking this tag or searching for it. To validate a tag, press Enter or click outside the input field. It is saved immediately. The number of tags is not limited. Click on a tag to remove it (in edit mode). Tags are common to a team. Autocompletion favors the reuse of existing tags.
The “Visibility” and “Can write” part allow you to control who can access this entry. Click the Edit button to display a menu and add or remove permissions.
This is where you describe your experiment and write your results. It is a rich text editor where you can have formatting, tables, colors, images, links, etc…
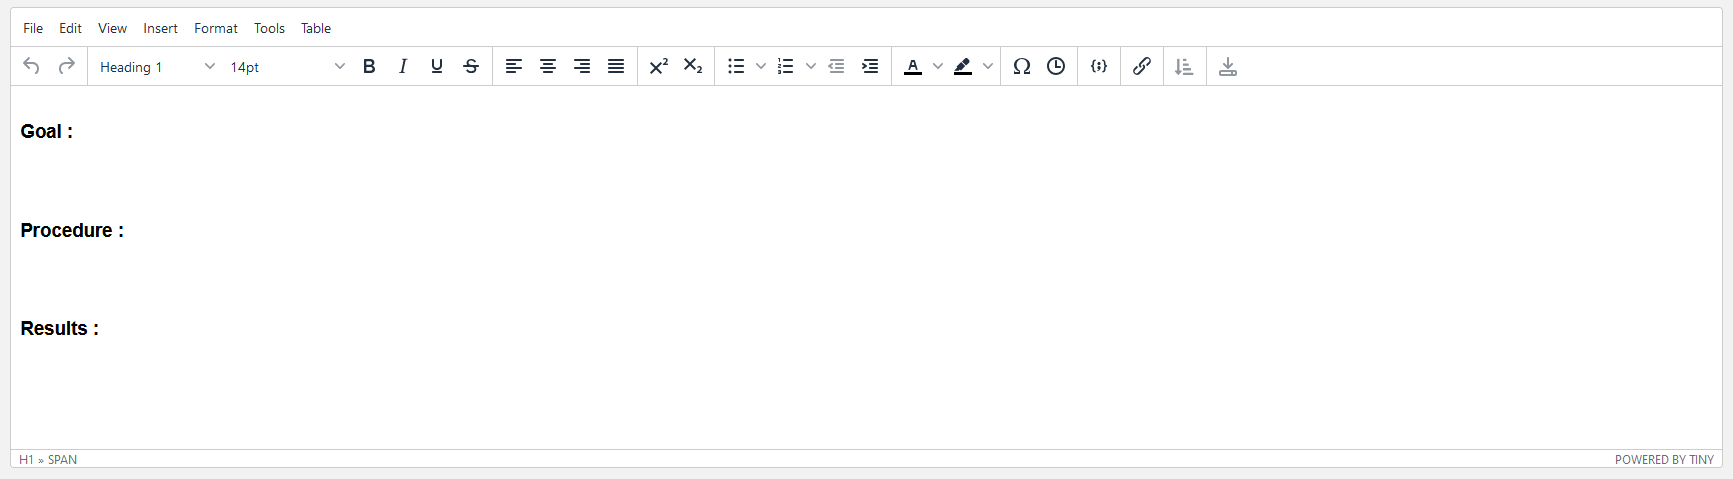
To insert an image in the main text, simple drag and drop it in the text zone.
If you add tables you might want to sort the data in the table dynamically. eLabFTW got you covered. Sort
icons will be displayed in view mode when so called header cells (<th>) are defined and
a table is set sortable. The table should have column names in the top row. You can select the top row
with the mouse by clicking the left mouse button on the leftmost cell and while keeping the mouse button
pressed move the mouse to the rightmost cell. Release the mouse button. The top row should be
highlighted now. Next, from the rich text editor menu select «Table» → «Cell» → «Cell properties». In
the dialog change «Cell type» from «Cell» (<td>)
to «Header cell» (<th>).
Finally, you can activate the sorting by clicking the «sortable table» icon (![]() )
in the tool bar. The icon will also indicate whether a selected table is sortable. After you saved the
changes you can go to view mode and dynamically sort the table. The changed order is not stored in
eLabFTW. Merged cells in the top/header row (colspan) and in columns (rowspan) are not supported.
)
in the tool bar. The icon will also indicate whether a selected table is sortable. After you saved the
changes you can go to view mode and dynamically sort the table. The changed order is not stored in
eLabFTW. Merged cells in the top/header row (colspan) and in columns (rowspan) are not supported.
It is possible to express mathematical/chemical notations in eLabFTW, and they will be rendered properly in view mode but also in the pdf export.
For this eLabFTW uses Mathjax with ams extension.
Try this (make sure it is not pasted between <pre> tags!):
$$\sum_{i=0}^n i^2 = \frac{(n^2+n)(2n+1)}{6}$$
Use one $ for inline mode and $$ for block mode.
Steps are a way to list the things one need to do during the experiment. So you can write several steps, and once they are done, click the checkbox to declare them finished. This is quite useful for long experiments spanning over several days, where the “Next step” will be shown in Show mode (index list), so you can see at one glance what is the next thing to do for this particular experiment.
Note that you can also declare steps in a template.
This field allows you to link an item from the database. Just begin to type the name of what you want to link and you will see an autocompletion list appear. Select the one you want and press Enter. The number of links is not limited.
This feature can also be used to link an experiment to a particular Project. If you have a «Project» Item Type and have a Project item in your database, you will then be able to see all experiments linked to this project by clicking the Link icon.
Same as above, but for experiments.
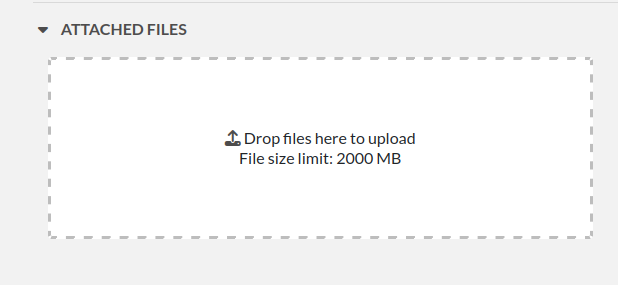
You can click this region to open a file browser, or drag-and-drop a file inside. The file size limit depends on the server configuration, but there is no limit on file type. If you upload an image, a thumbnail will be created. There is no limit on the number of files you can attach to an experiment.
Some files are recognized by eLabFTW:
molecules files such as cif, pdb, sdf, mol files, they will display the molecule in 2D or 3D
DNA files such as fasta, gb, ape, dna, gff, they will display a fully featured viewer
images such as png, jpg, gif or tiff will get a thumbnail
pdf files also get a thumbnail and can optionally be included in pdf exports
The Switch Editor entry will switch from the WYSIWYG editor (TinyMCE) to the markdown editor. And the Delete entry is to remove the experiment.
When you are done, click the «Save and go back» button.
You are now in view mode.
In the view mode, you will find an actions button bar in the upper left part:
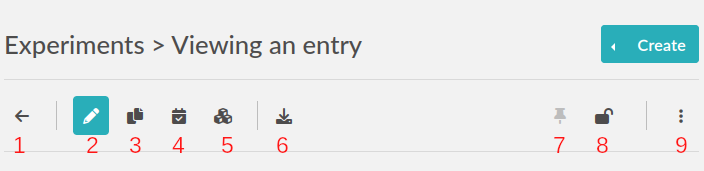
Go back to the listing.
Switch to edit mode.
Duplicating an experiment allows you to quickly create a new entry with the same Title, tags, body and links, but with today’s date and a running status. Uploaded files are not duplicated. A «I» character will be added to the title to denote that it is a replicate.
When you click this button, a timestamp archive is created. Timestamping an entry involves generating a full JSON export of the entry and creating a cryptographic hash of that data. This hash is then sent to a trusted third party: the TimeStamping Authority (TSA).
The TSA acknowledges the existence of the data and sends back a signed token, which serves as proof that the data existed at that specific time. This process follows the RFC 3161 standard for Trusted Timestamping.
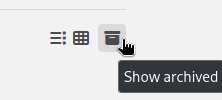
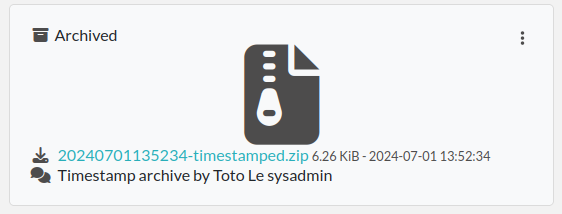
The timestamped data and its token are then saved in the “Attached Files” section of the experiment as a zip file. This file is initially in an “Archived” state, meaning it is hidden from view by default. To view archived files, click the “Show Archived” button on the right side of the “Uploaded Files” section in edit mode:
This timestamp archive is immutable and cannot be modified or deleted.
This button, representing blocks, will do the same timestamping as above, except it will use the blockchain technology and the service provided by the BloxBerg consortium. You can learn more about it here: BloxBerg website.
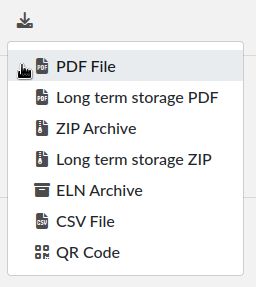
The Export menu allows you to save the entry in different formats. The term “Long term storage” refers to the PDF or the PDF contained in the zip archive being of a particular kind: PDF/A, an ISO-standardized version of the PDF format. It is a PDF format designed for long term storage, but transparent PNG will appear with a black background, so they are no longer the default PDF format, but an option. The PDF/A will also include the changelog, unlike the normal PDF export. It is the PDF format used for timestamping.
The ELN format is a new file format based on RO-Crate specification, containing a special file (in JSON-LD) describing the contents of the dataset (one or several experiments). It is a format designed and promoted by The ELN Consortium, an association of several ELN vendors that agreed on an interchange format for export/import of datasets. You can learn more about it here: TheELNConsortium on GitHub.
Clicking this icon will make this entry appear on top of the listing (pin entry).
The lock icon allows you to lock the entry to prevent further editing. If you lock it yourself, you can later unlock it, but if it is locked by an admin, a user won’t be able to unlock it.
In the bottom right part of the experiment, you can see something like: «Unique elabid: 20150526-e72646c3ecf59b4f72147a52707629150bca0f91». This number is unique to each experiment, and immutable (won’t ever change). You can use it to reference an experiment with an external database.
People can leave comments on experiments. They cannot edit your experiment, but they can leave a comment.
Linking data throughout the research process is essential to uphold the FAIR principles of data management [2]: Findable, Accessible, Interoperable, and Reusable. Currently, there is a significant gap in the availability of a system or software capable of linking data from various bioimage sources. To address this, we propose LEO (Linking Electronic Lab Notebooks with OMERO), a web-based solution. While LEO was originally designed to integrate only electronic lab notebooks (ELNs) with the bioimage repository OMERO, it has now evolved into a cloud-based system that allows the integration of additional data providers through a plugin system.
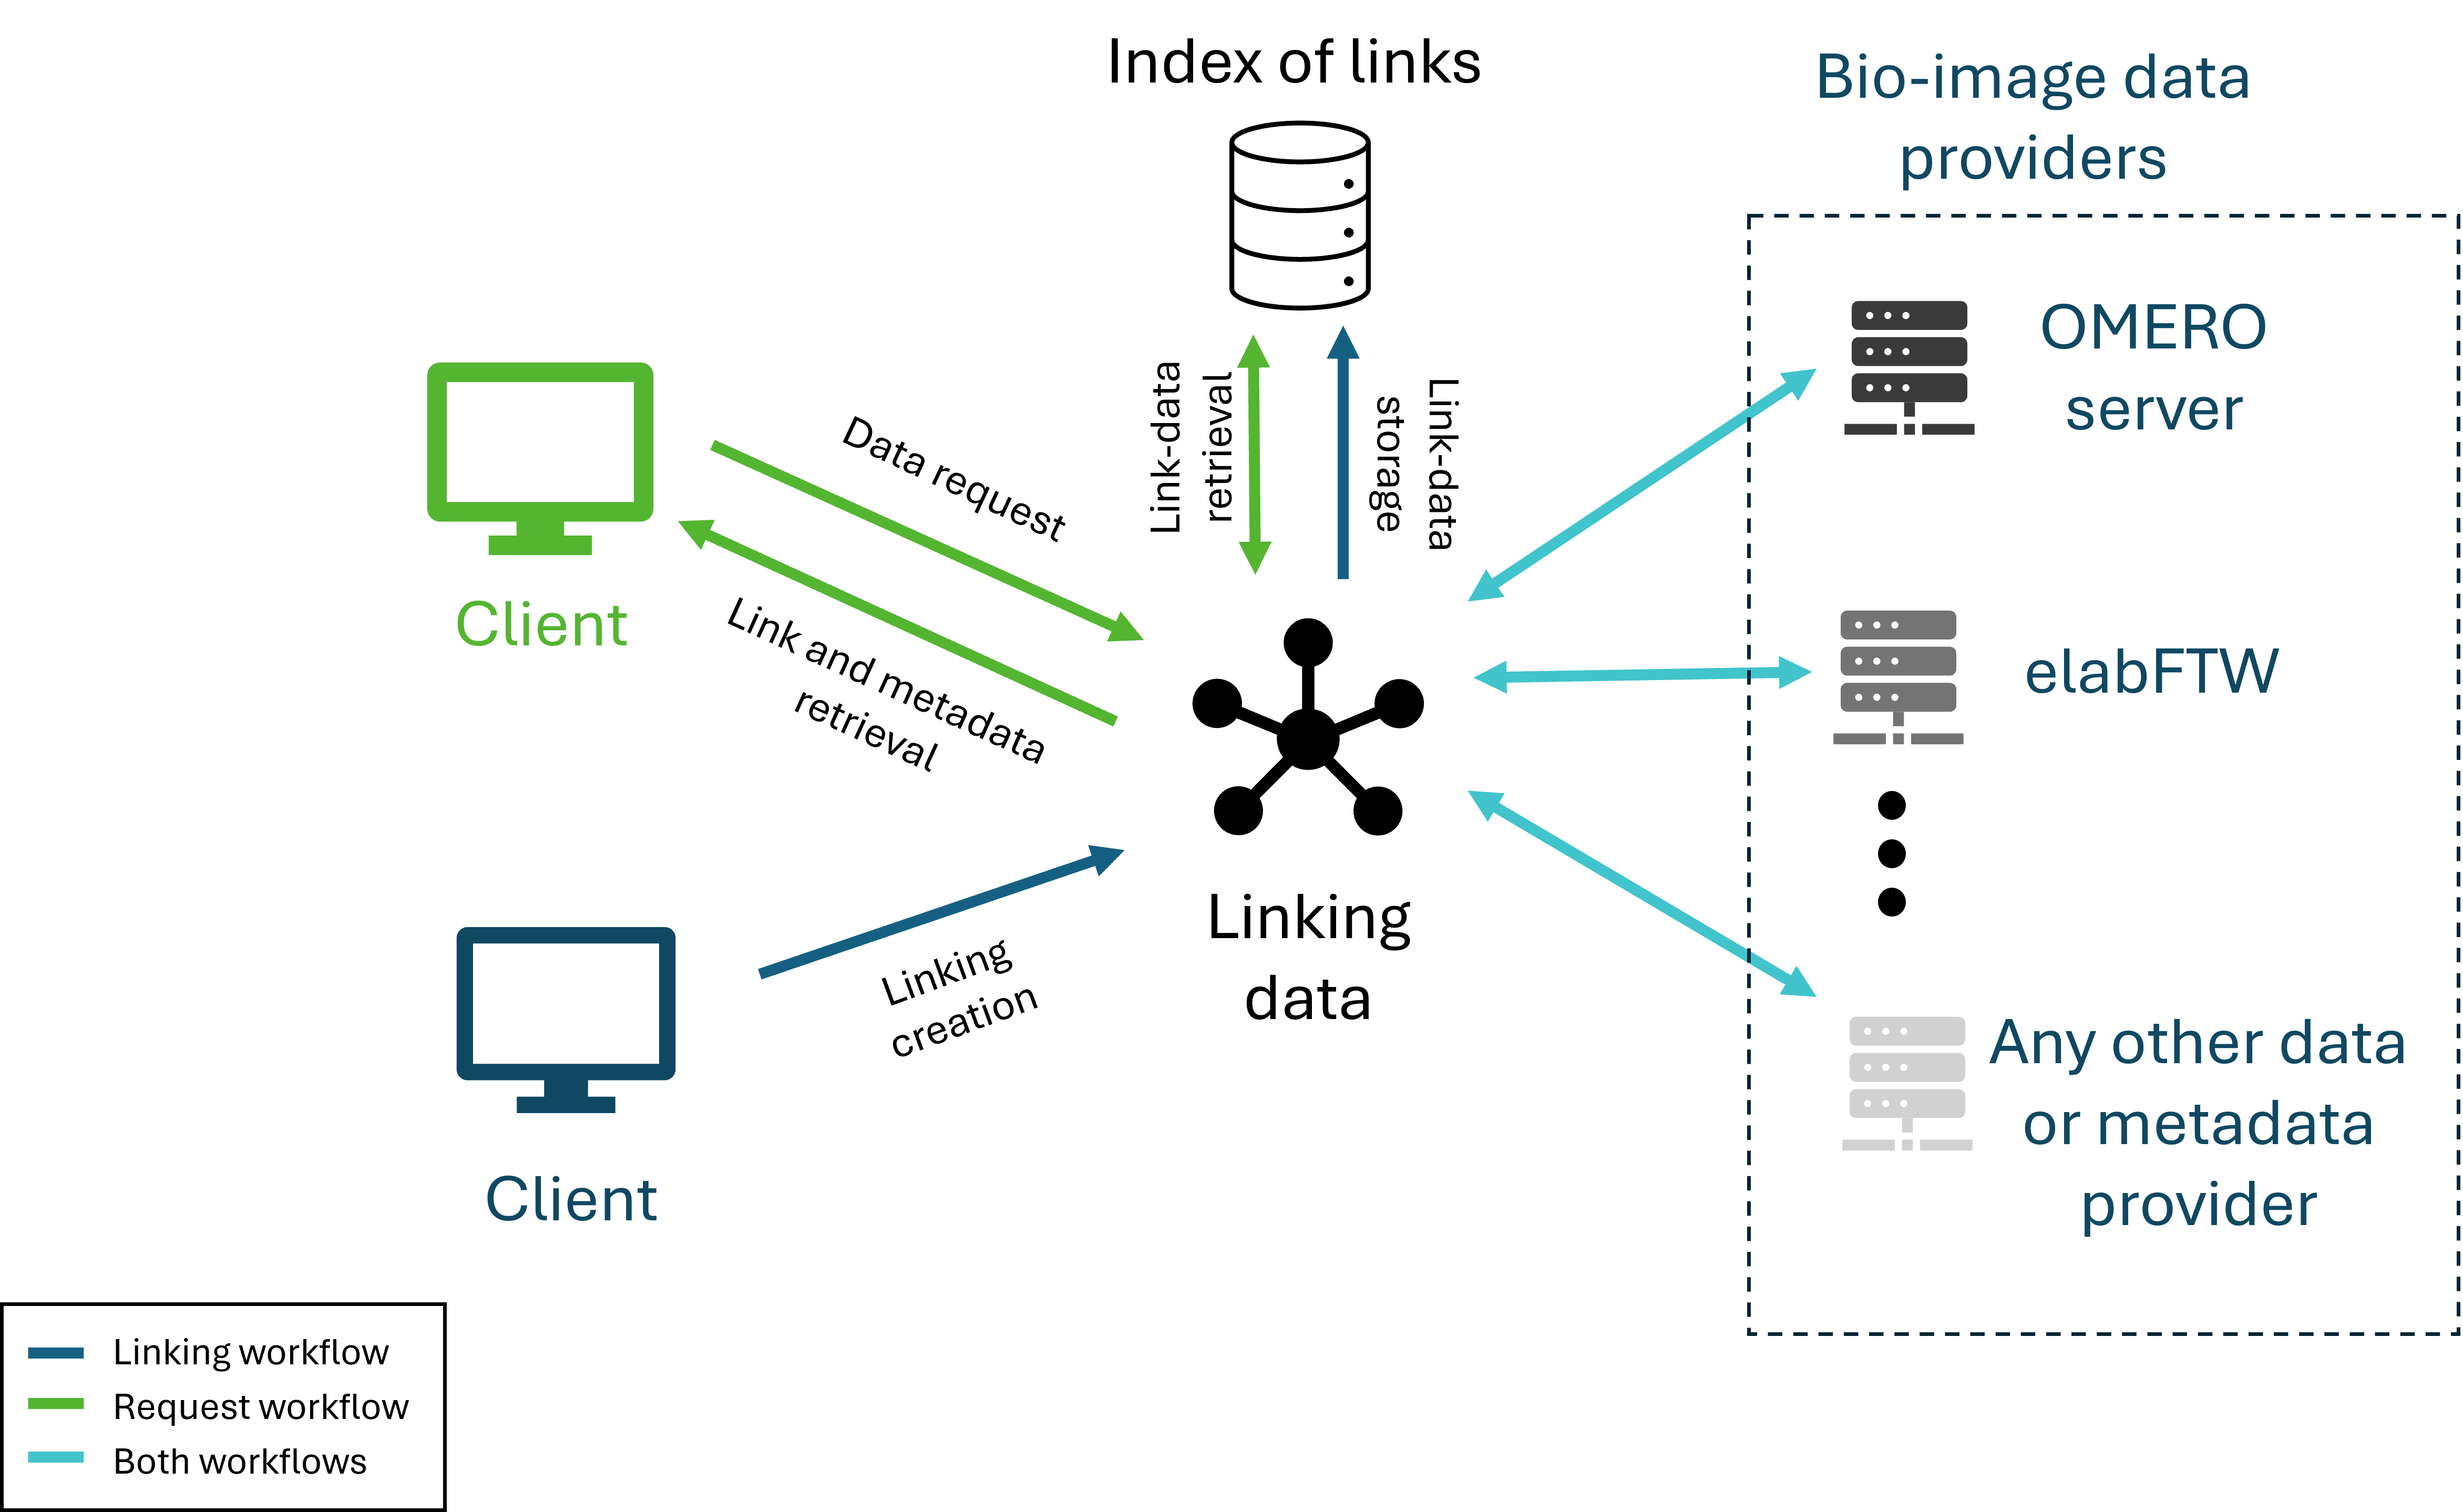
LEO operates via two main workflows (Fig. 13). First, users can define and establish links between data elements from different providers through an intuitive interface, with these connections stored locally. For example, an experiment recorded in an ELN can be directly linked to one or multiple images, projects, or datasets in OMERO. Second, users can easily retrieve and visualize these established relationships, with a summary displaying essential metadata from each provider.
LEO can be acces by using the next link: "https://leo.k8s.photonicdata.science/"
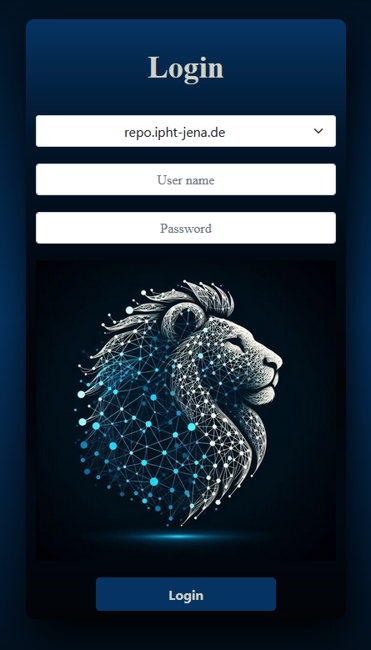
The LEO system connects directly to OMERO for user authentication, meaning users must log in with the same credentials they use for OMERO. Figure 17 shows the LEO startup window. LEO supports connections to multiple servers, with the default server being the IPHT server ( repo.ipht-jena.de).
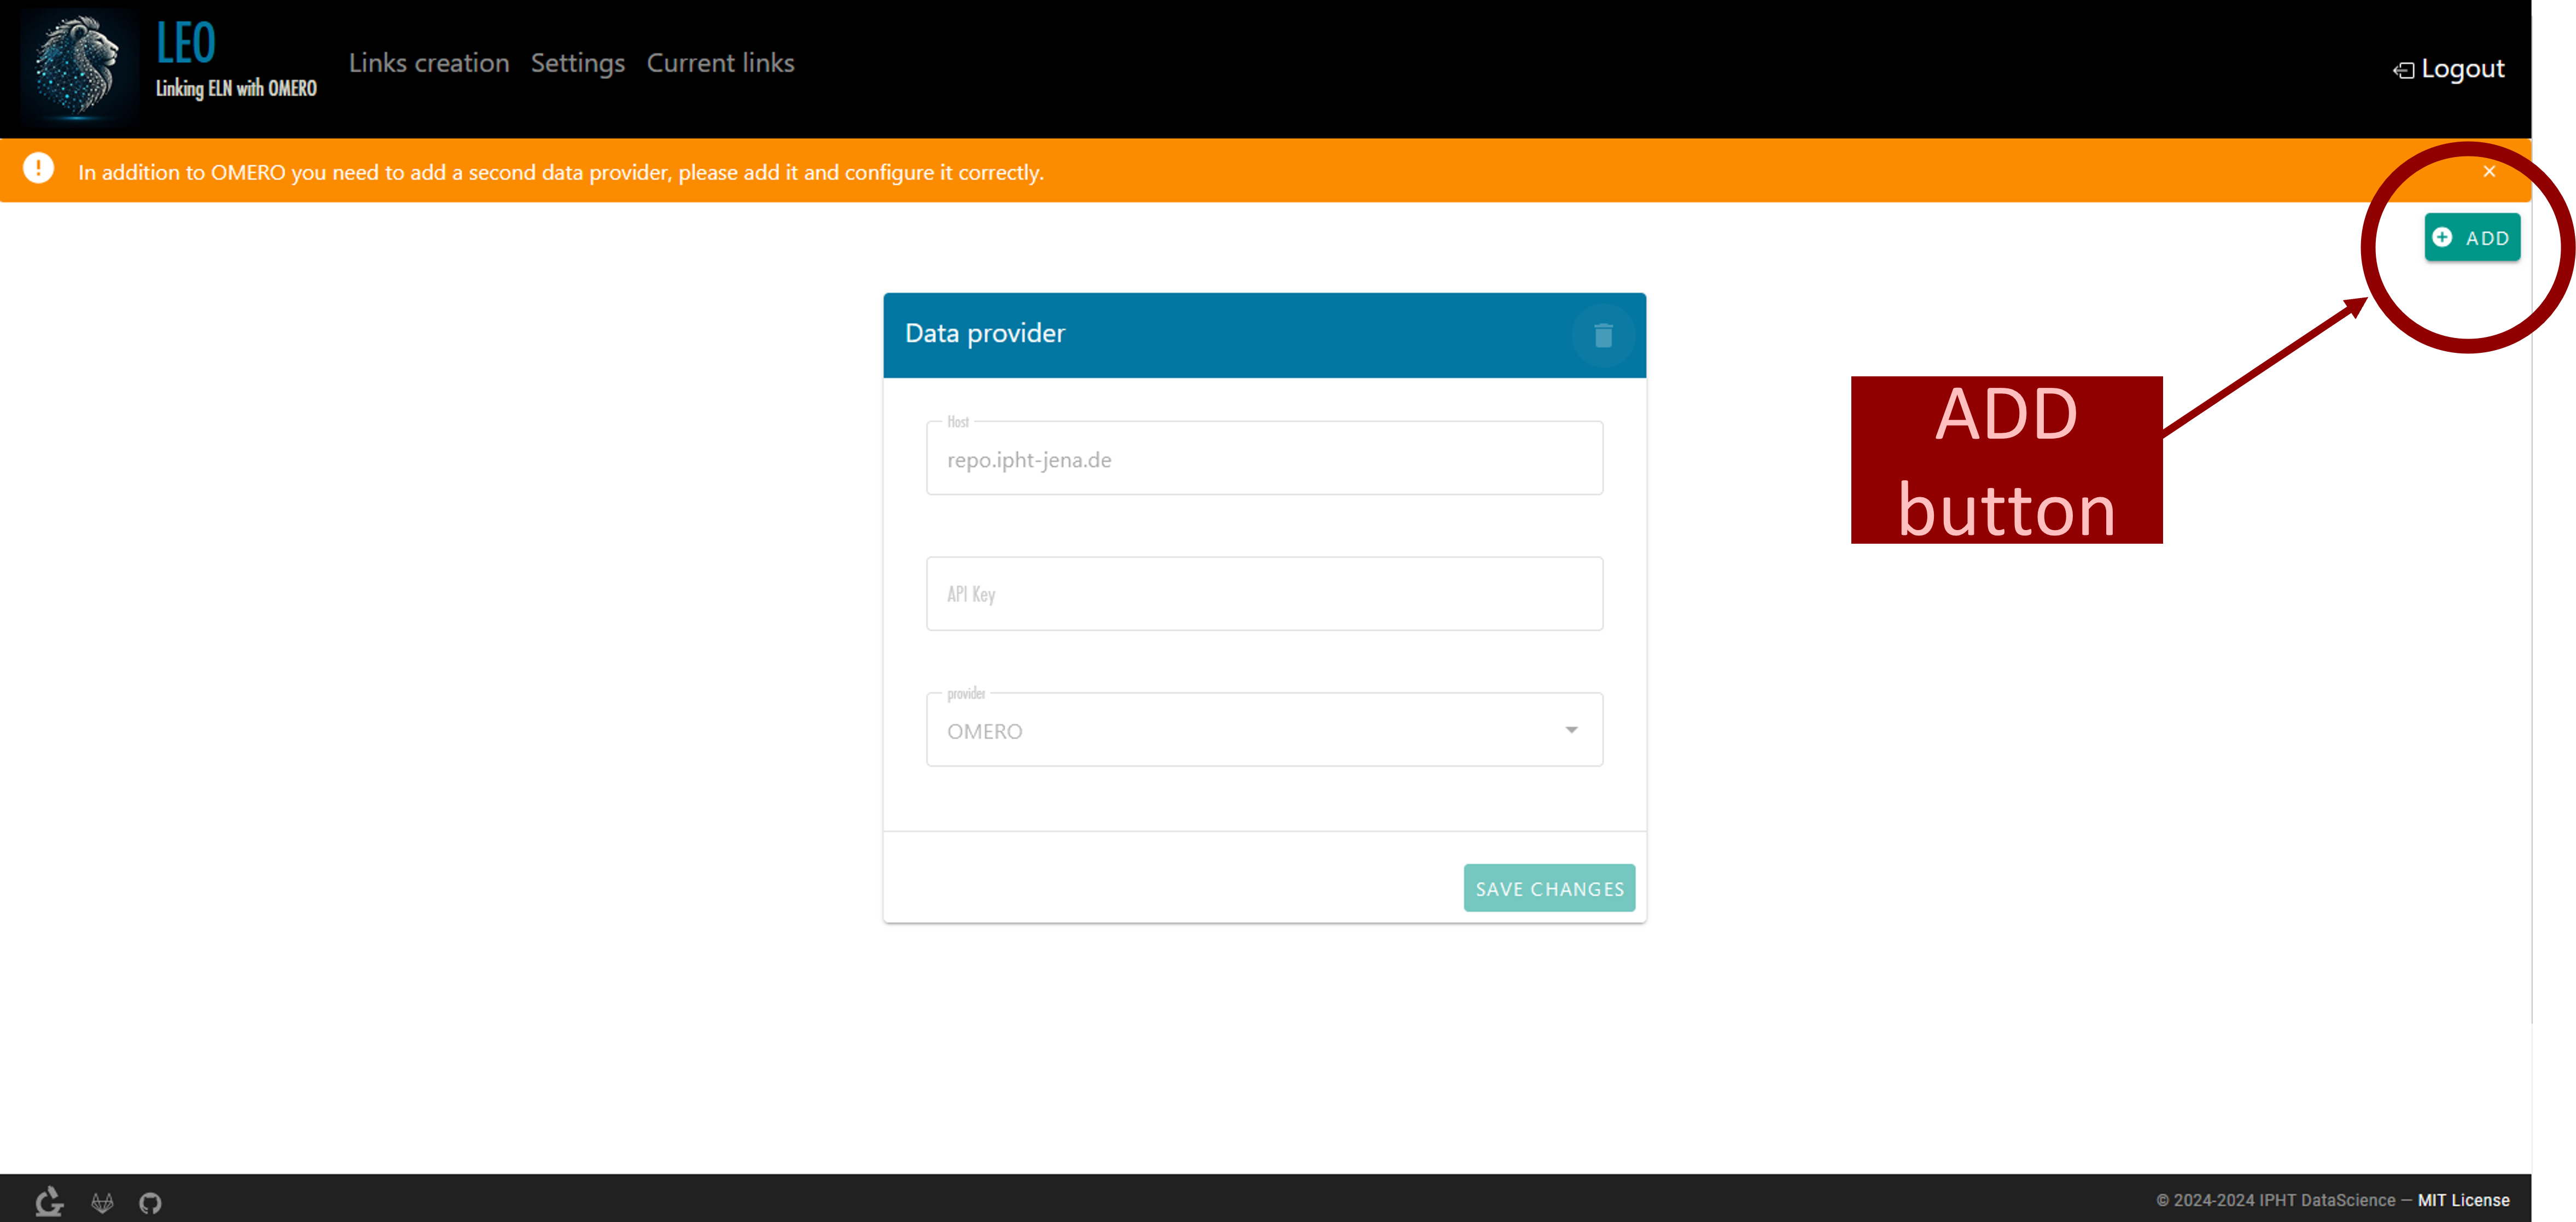
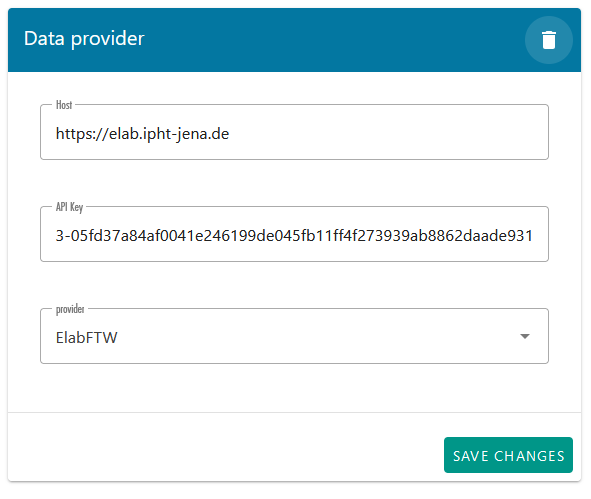
The first time you log in, additional configuration is required to link LEO with your elabFTW account. Upon entering LEO, you will see the message: “In addition to OMERO, you need to add a second data provider. Please add and configure it correctly.” To do this, go to the settings and press the “ADD” button located in the upper right corner (Figure 18). A new data provider entry will be created. For the host, enter “https://elab.ipht-jena.de” (the address of the elabFTW server at IPHT). Select "ElabFTW" as the provider, and in the API key field (a code used to authenticate and identify a user or application), enter the API key generated in our elabFTW account(how to generate this key will be explained later in this document.).An example is shown in Figure 19.
Once all the required fields are filled in, the “SAVE CHANGES” button will be enabled and should be pressed. If everything is configured correctly, you can then proceed to create links between the data providers.
Let's first start by defining what a KEY API is. An API key is like a password that allows different apps or systems to talk to each other securely. Think of it as a special key that only authorized users have, so they can access certain parts of a system without needing to log in every time. In our system, the API key is necessary because it makes sure only authorized users can access important data or features. It helps keep everything safe by making sure no one else can use our system without permission.
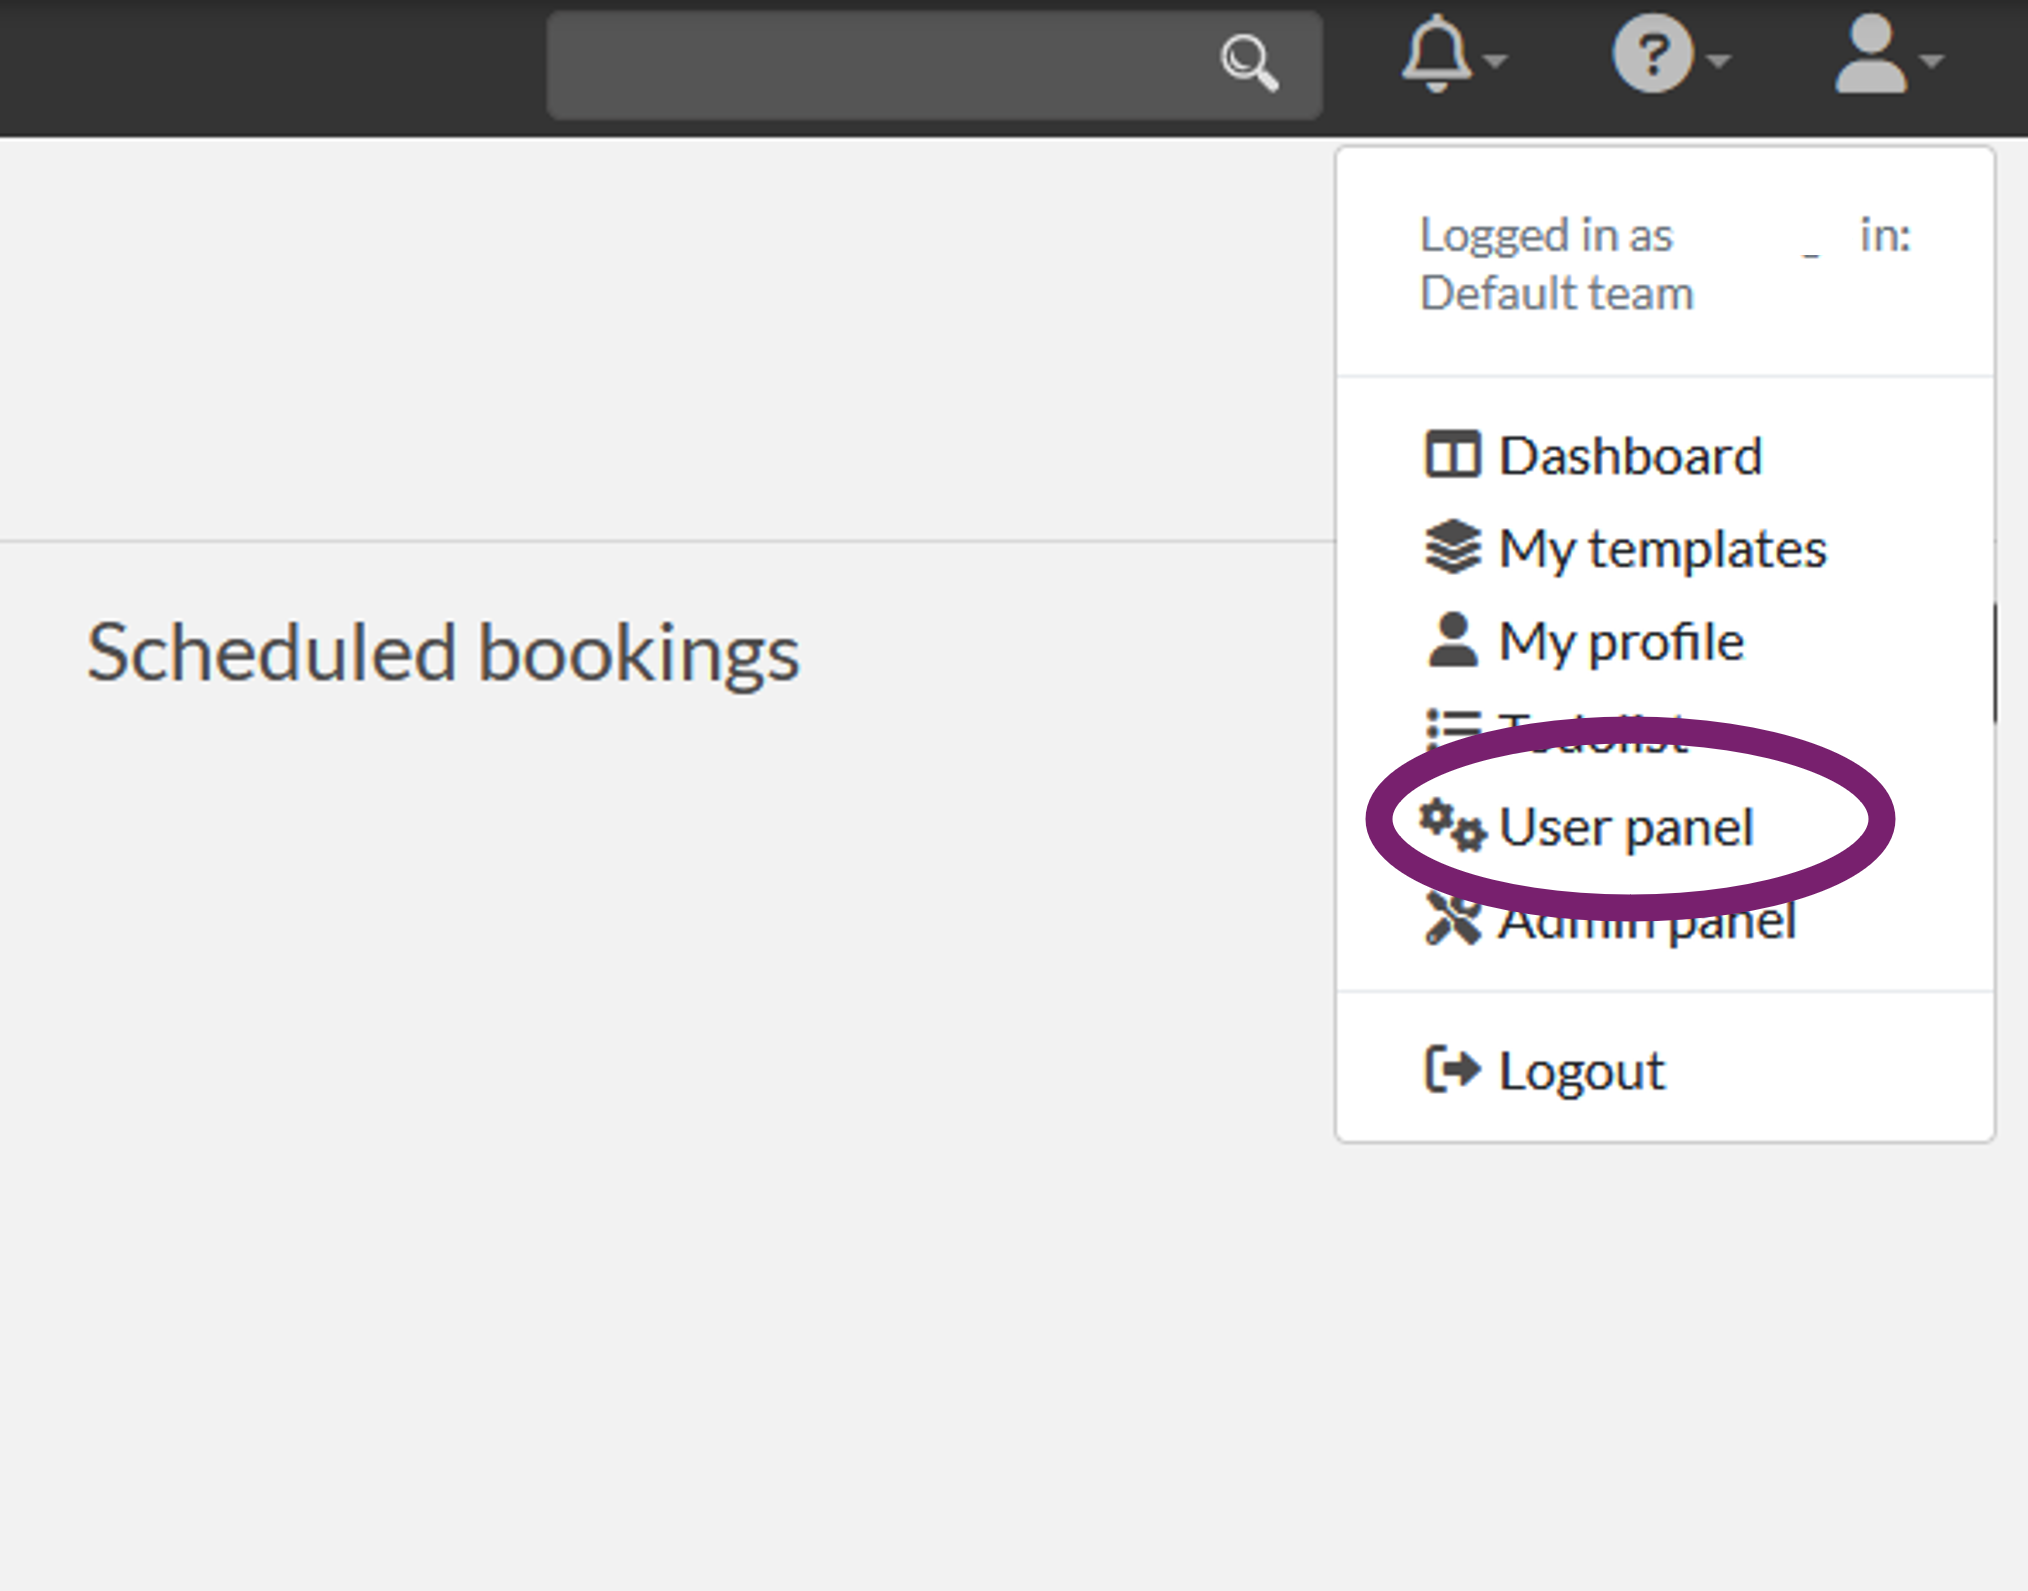
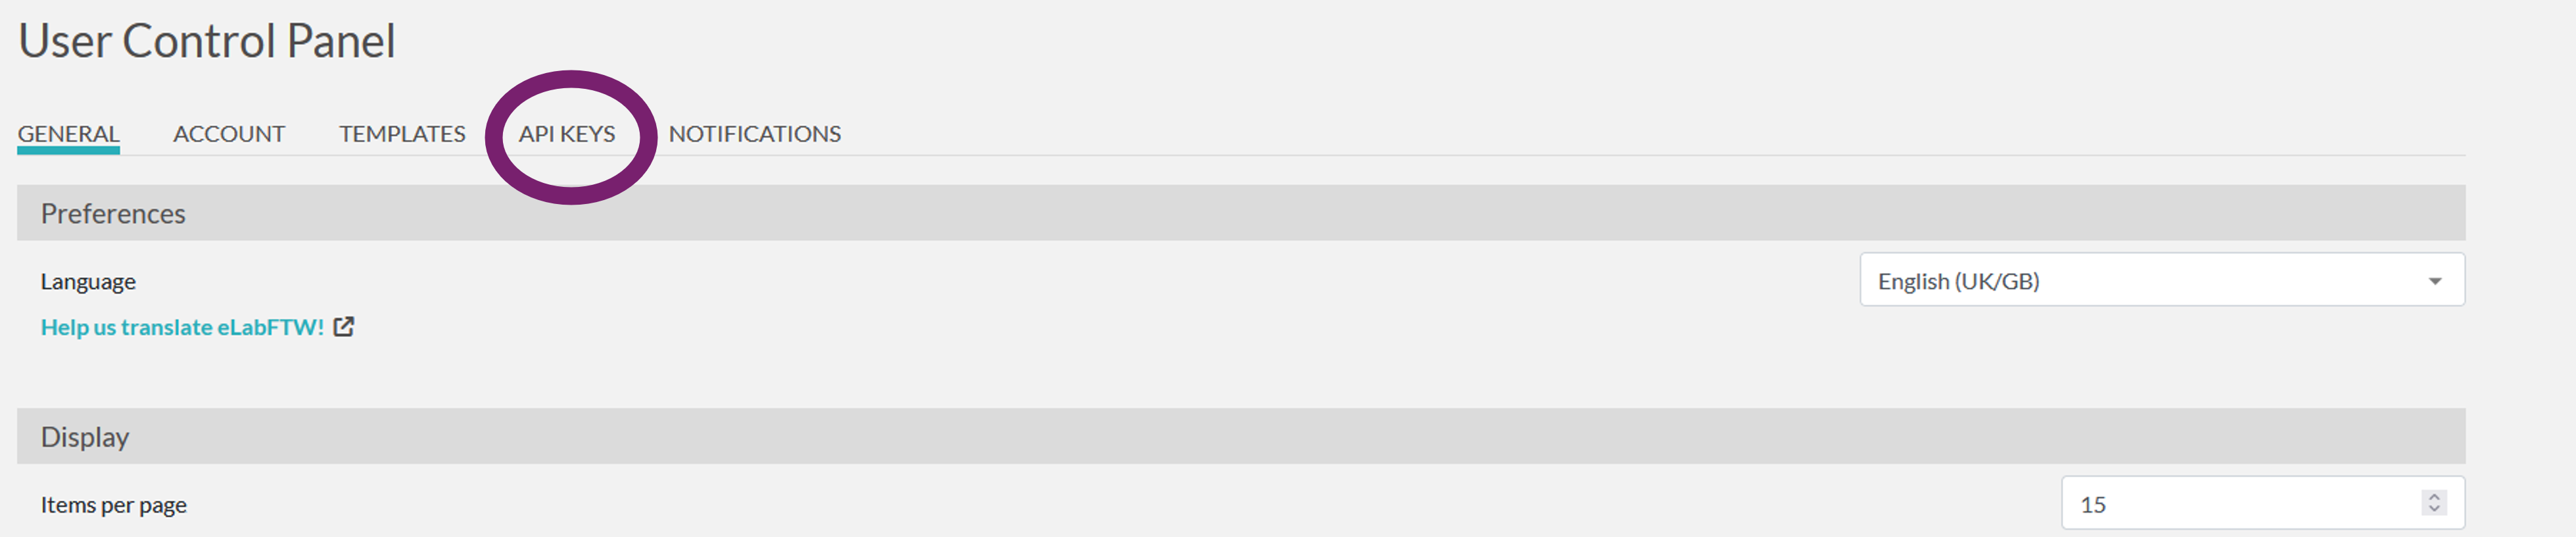
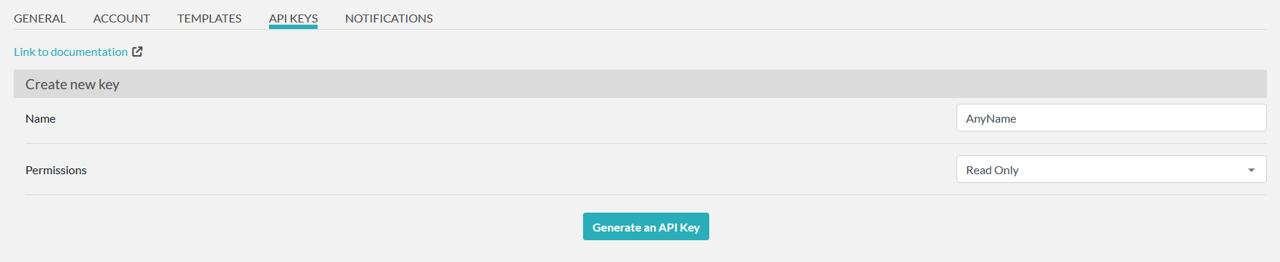
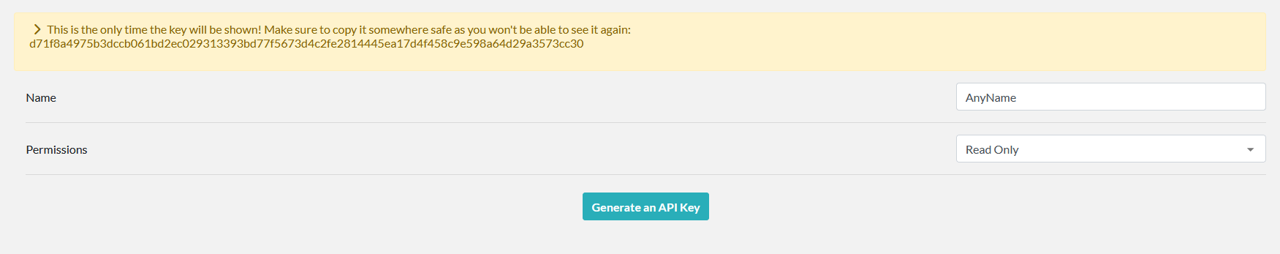
To generate an API key in elabFTW, first log in to https://elab.ipht-jena.de. Once logged in, go to the user menu in the upper right corner and open the user panel (Figure 20). In the user panel, navigate to the "API KEYS" tab (Figure 21). Under the "Create new key" section, enter a name in the Name field to help you identify the key, and set the permissions to "Read Only" (Figure 22). Then, click the “Generate an API Key” button. The key will be displayed only once (Figure 23), so make sure to copy it and paste it into LEO. If you forget to copy the key and it is no longer visible, you will need to delete the previously generated key and create a new one.
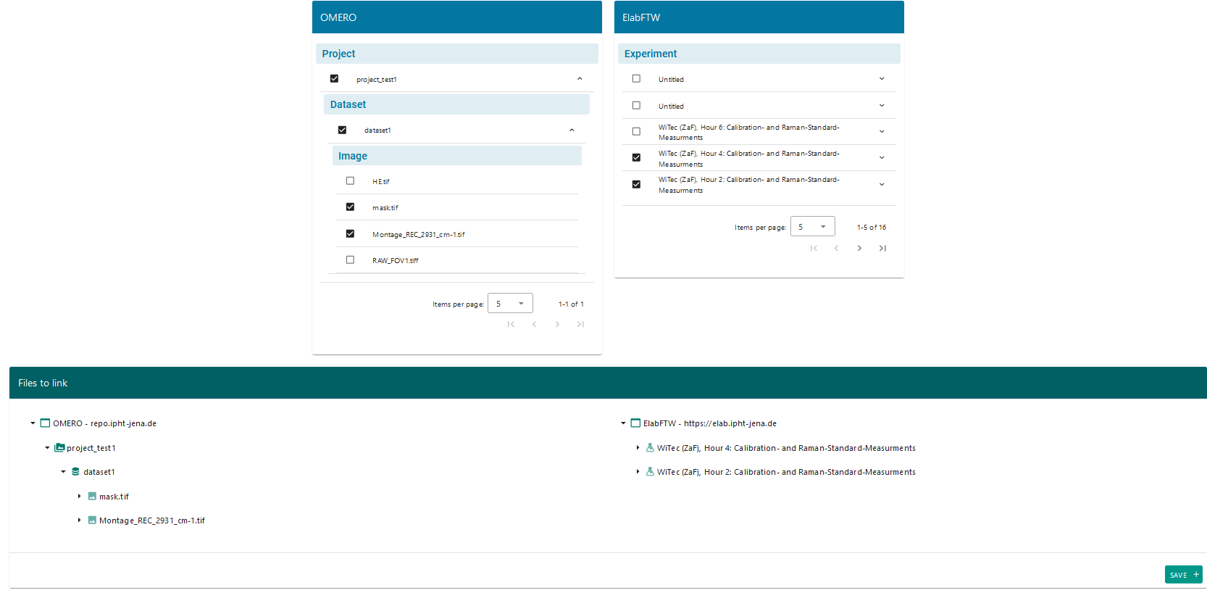
Once the initial configuration is complete, you can create your first links between OMERO and elabFTW. To do this in LEO, go to the “Links Creation” tab. In this window, you will see two blue sections and one green section. The blue sections display information from the data providers, in this case OMERO and elabFTW. The OMERO section will show all the projects associated with your account, while the elabFTW section will display all the experiments you have access to. The information is presented in a hierarchical tree format that you can expand—for example, within the OMERO section, you can view datasets under a project and images within each dataset.
To create a link, simply check the box to the left of the item’s name. When you select a parent object, all its child elements will be automatically selected, though you can deselect individual items if needed. The green section will provide a preview of the elements you’ve chosen to link. Figure 24 shows an example where two images from OMERO and two experiments from elabFTW were selected. The selected images belong to a dataset and project, which are also shown in the preview.
Once you verify that the information is correct, save the link by clicking the “Save” button.
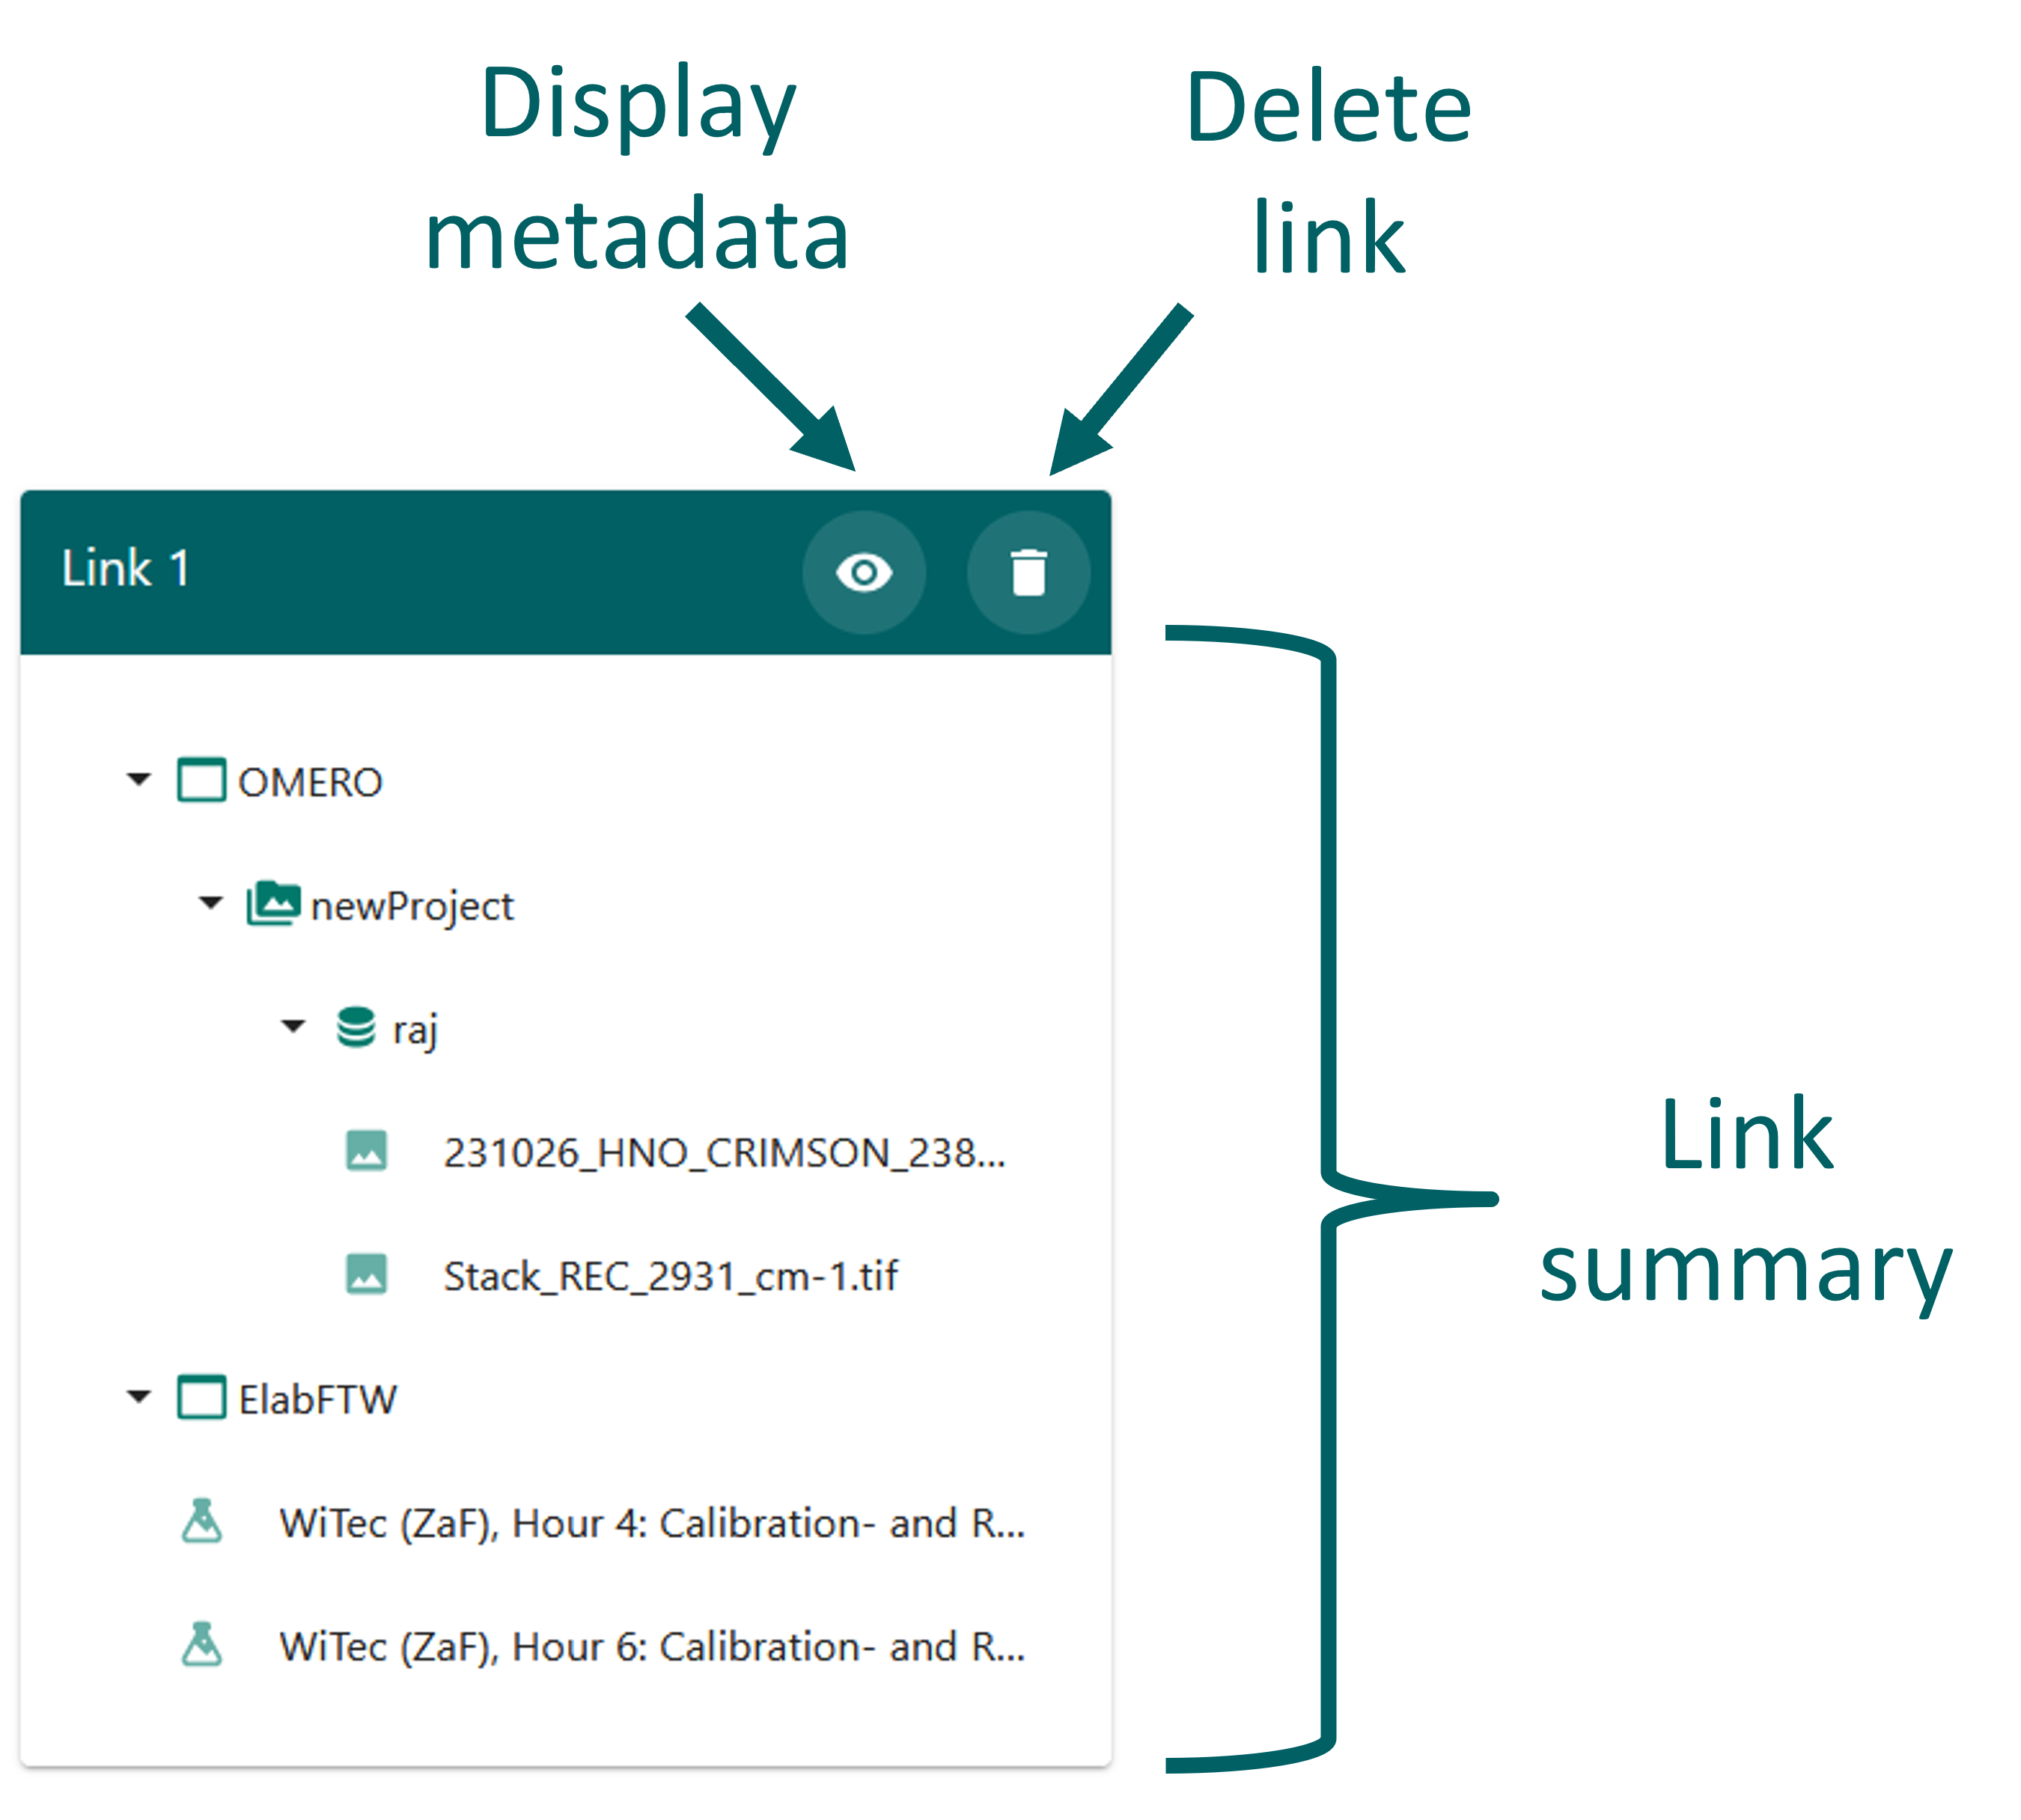
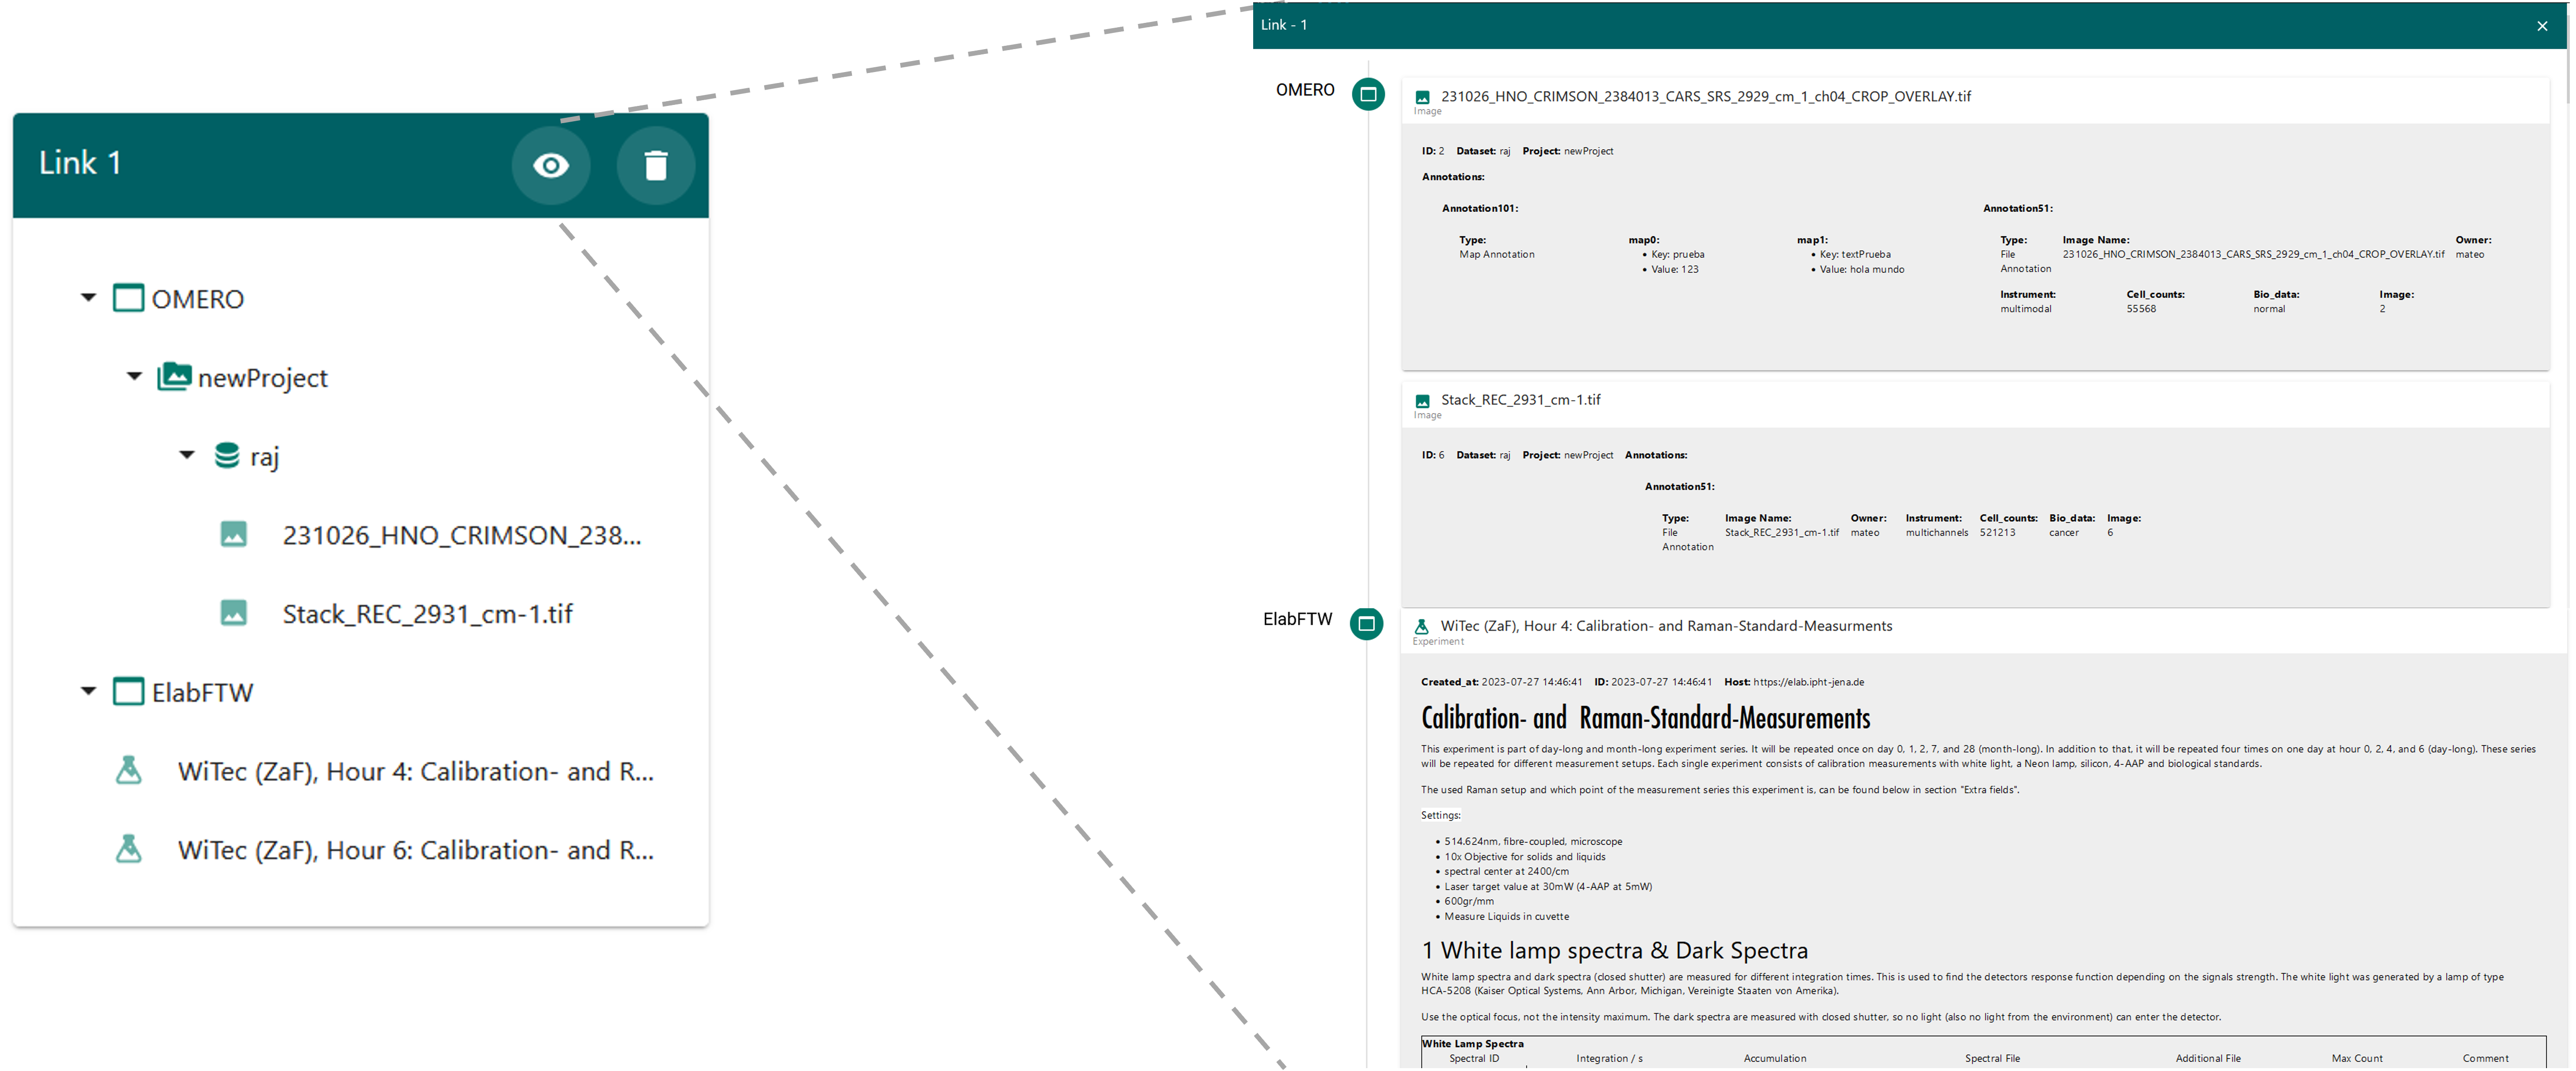
Once links have been created, they can be accessed in the “Current Links” window. This window displays a green frame for each previously created link. In Figure 25, you can see all the elements contained within each link. By clicking on the eye icon, you can open and view the metadata details associated with that particular link, as shown in Figure 26.
Metadata is essentially information about data. In the context of imaging, it refers to the details that accompany the actual pixel values captured by a microscope.
Different Types of Metadata
Working with Metadata in OMERO
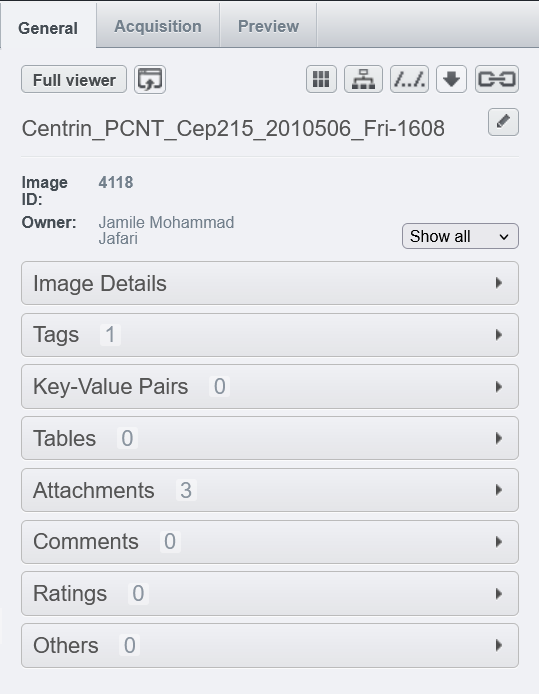
OMERO offers several useful tools for structured metadata annotation, allowing researchers or research groups to organize their bioimaging data effectively. In OMERO, metadata can be found in several locations:
The simplest way to add metadata to OMERO is by using a CSV file and running the "Populate Metadata" script. To do this, follow these steps:
Log in to OMERO.web at repo.ipht-jena.de.
Enter your username and password.
Select an existing dataset or project. Click on the script icon  above the central pane, expand it, and locate the "Import Scripts" section. From there,
choose the "Populate Metadata" script, which will open the script dialog.
above the central pane, expand it, and locate the "Import Scripts" section. From there,
choose the "Populate Metadata" script, which will open the script dialog.
Select DataType to populate (Dataset or Project)
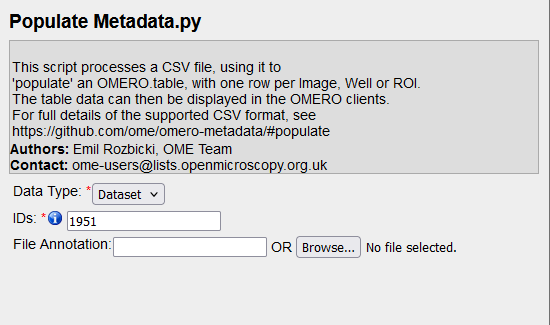
Click the "Browse" button and select the CSV file from your local machine.
Click "OK" to run the script and wait for it to complete in the Activities panel (top-right corner above the central pane).
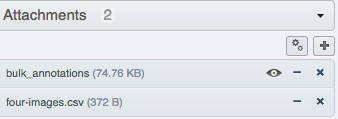
Click the dataset or project in the left-hand pane to refresh and verify that a new attachment named "bulk_annotations" has been added under the "Attachments" accordion in the right-hand pane.
Select individual images within the dataset, and check the "Tables" accordion in the right-hand pane to see new values derived from your CSV file.
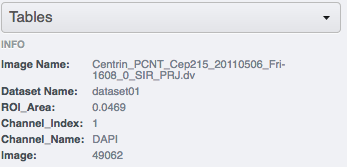
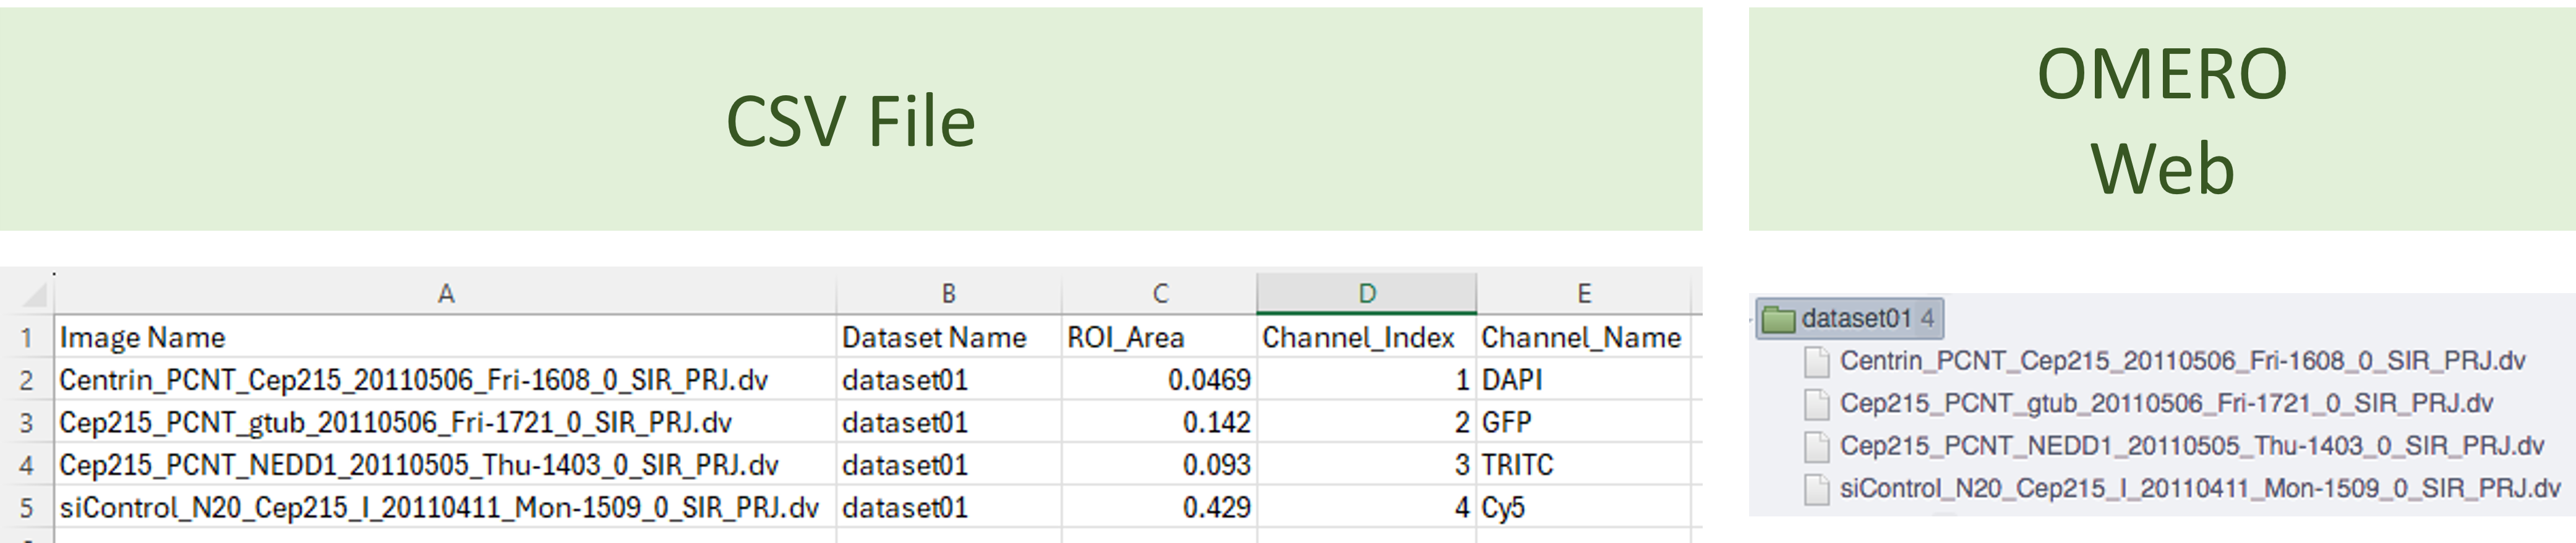
Figure 31 shows an example of CSV to add metadata to four images.
As described in the "Linking Data" section, LEO allows users to access and display information from various data providers. When the data provider differs from OMERO—for example, when using elabFTW—LEO will display a button labeled “+ Additional Actions” (Figure 32).
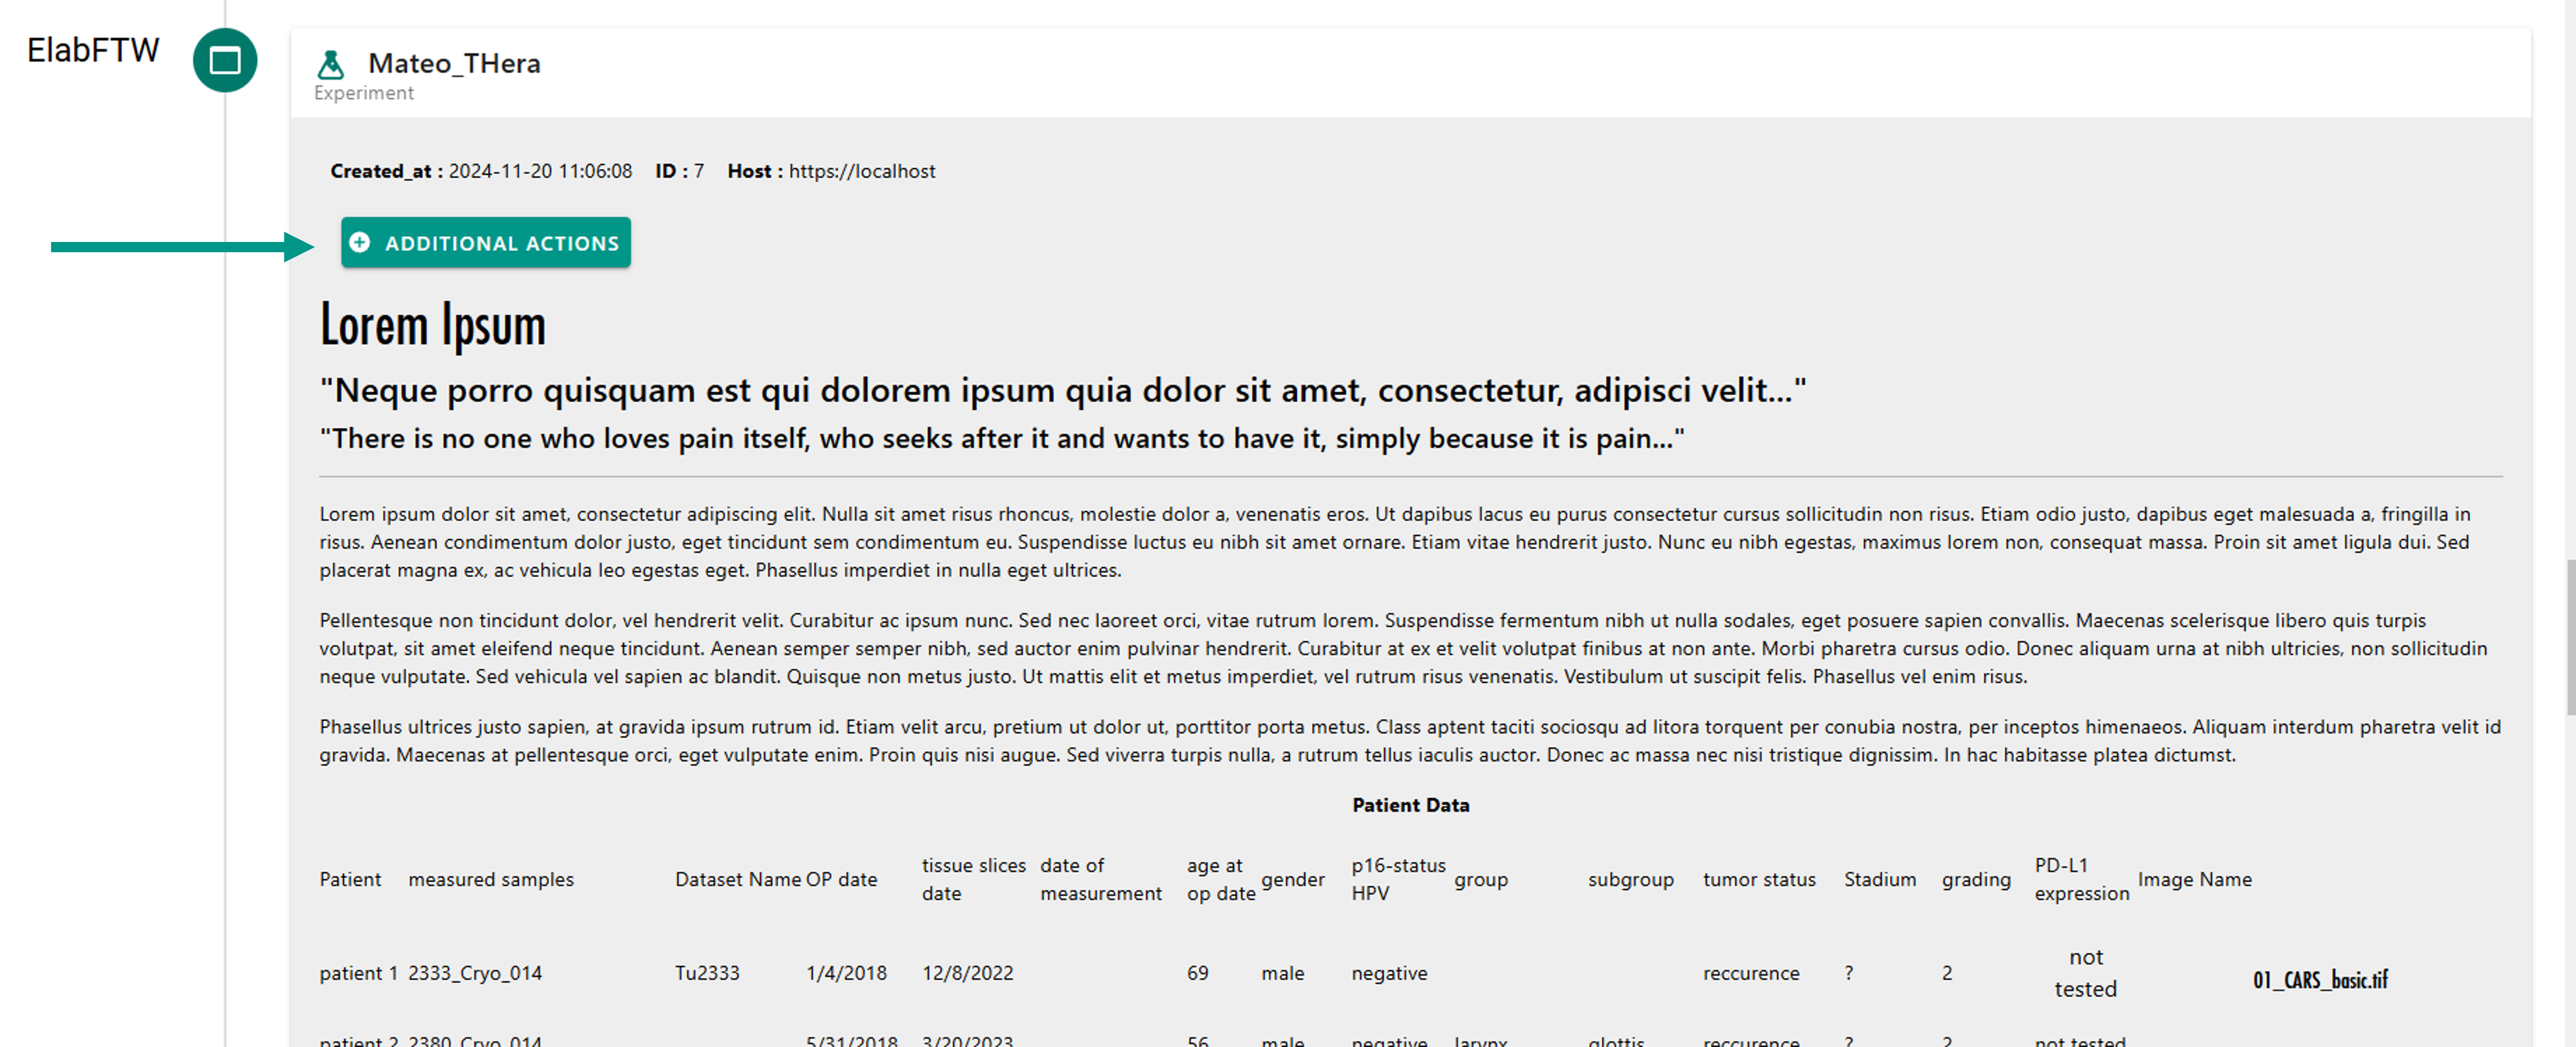
By clicking this button, LEO will extract all the tables within the selected experiment and display them in a new window (Figure 33).
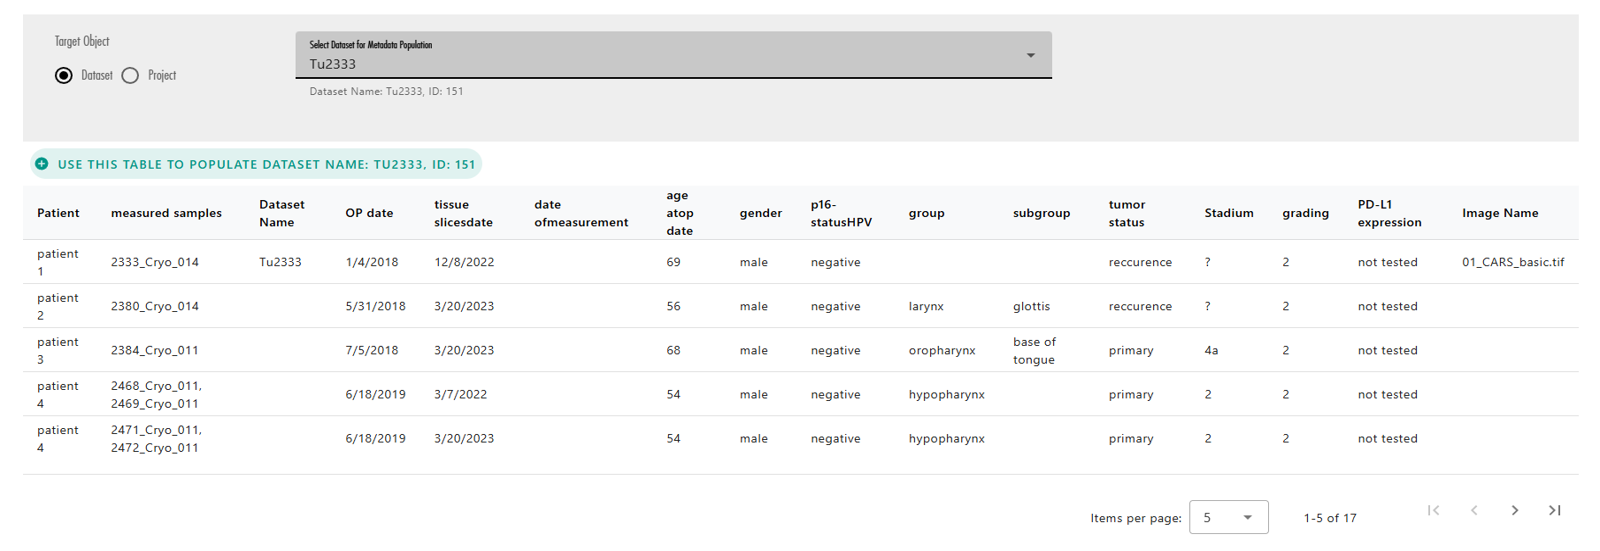
At the top of this window, there is a radio button that allows you to select the target OMERO object to populate (either a Project or a Dataset). Next to the radio button, a dynamic selector lists the available projects or datasets within the link set (Figure 33).
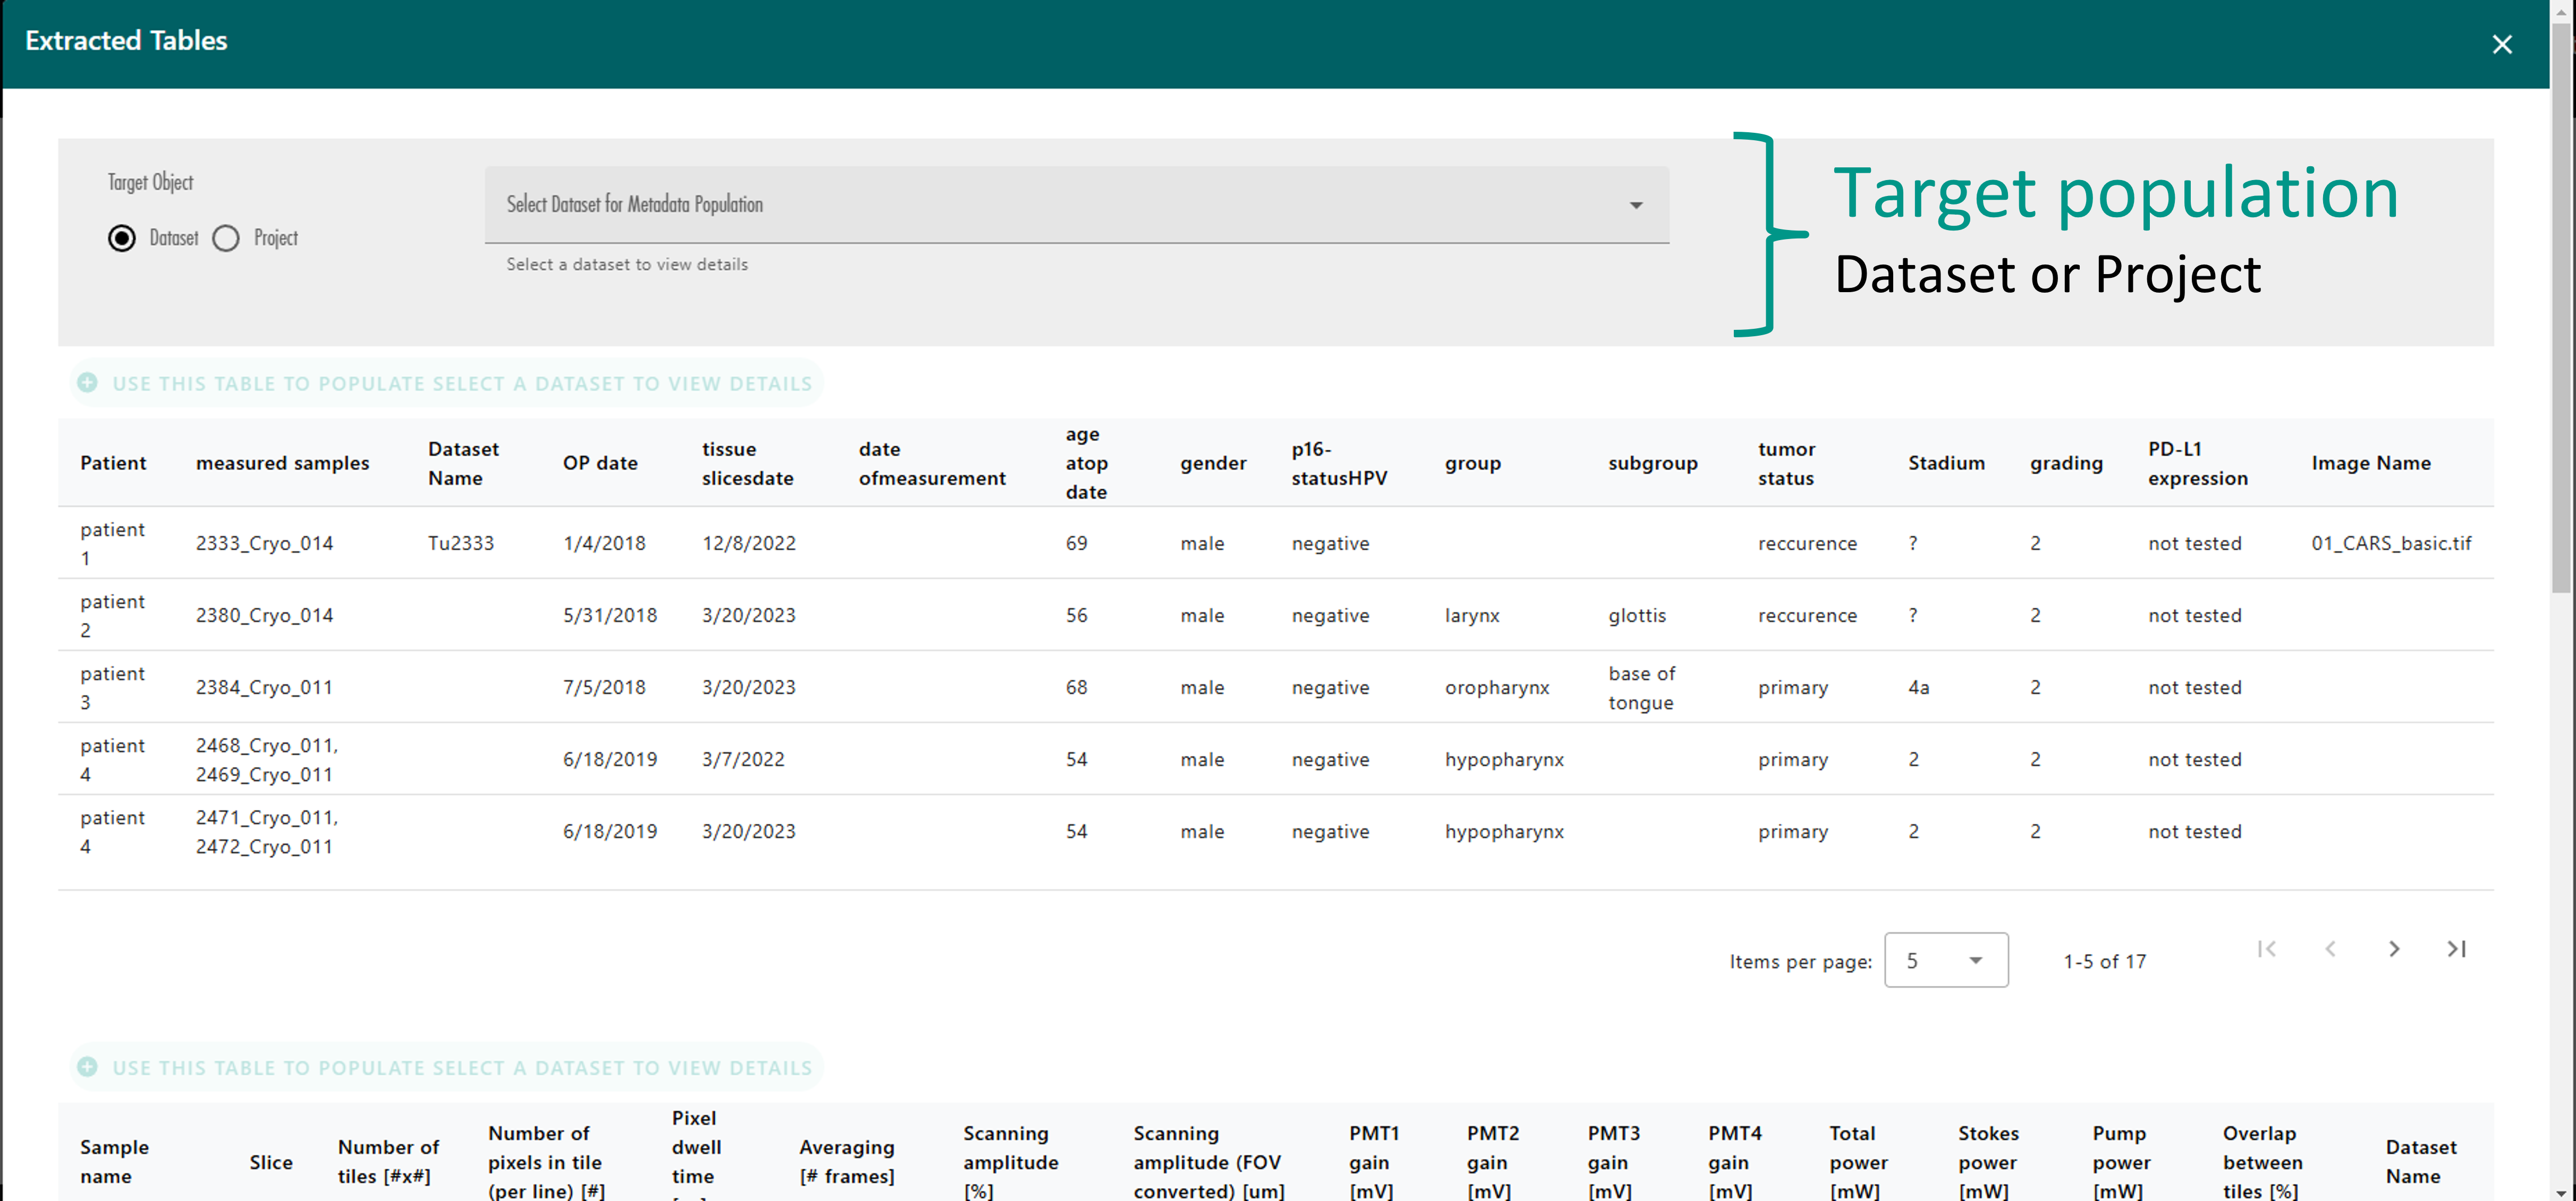
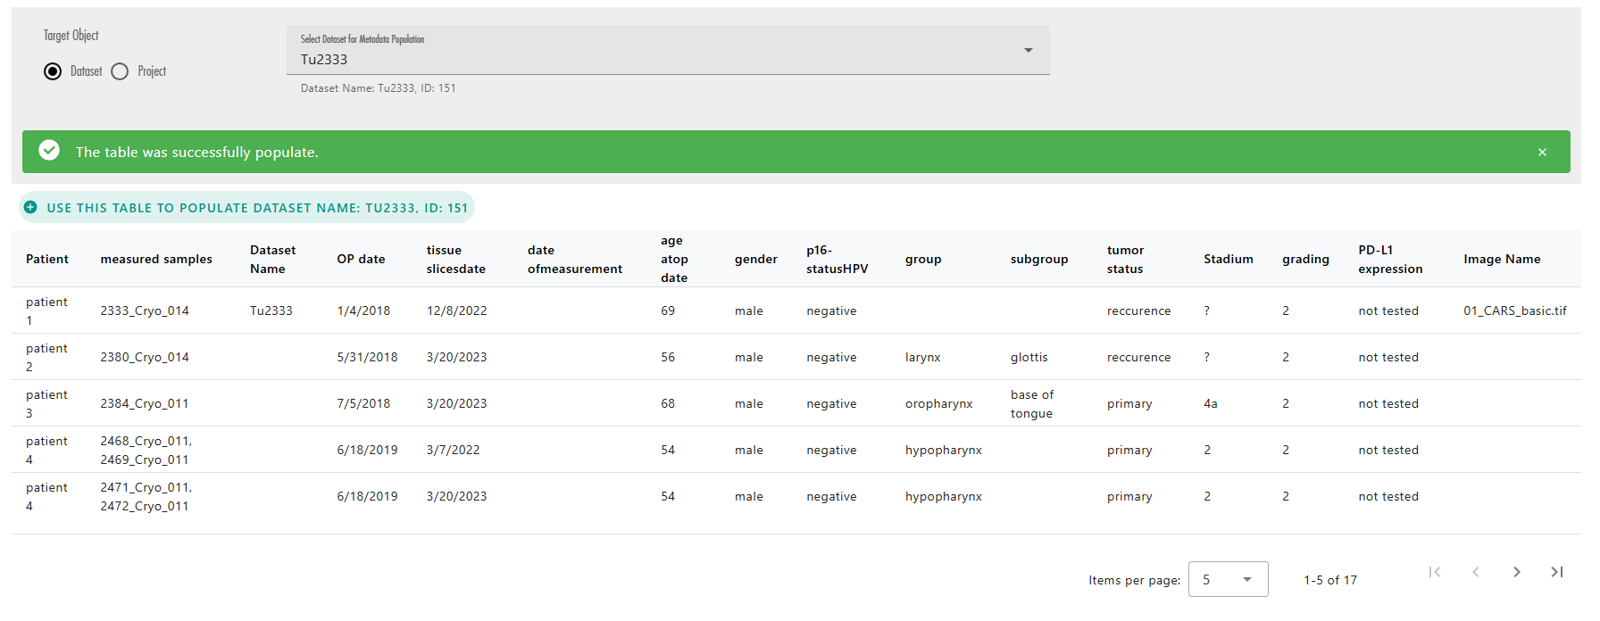
Once the target OMERO object is selected, the action buttons above each table will become enabled. These buttons allow you to choose which table you want to use to populate your selected OMERO object (Figure 34). After pressing one of these buttons, LEO will populate the object and display either a success or error message based on the outcome (Figure 35).
Dataset Name and Image Name,
the table will only be added to the selected OMERO object (Project or Dataset), but
it will not be applied to the images or datasets contained within that object.
Dataset Name column is not necessary.